
Please stop teaching the water cycle like it’s elementary school! Many middle school water cycle lessons accidentally become not much more than vocabulary practice. Students memorize evaporation, condensation, and precipitation, label a diagram, and maybe complete a coloring page. But middle school students are ready for much more! It’s time to move beyond memorization and into the kind of rigorous, evidence-based thinking that middle school science was designed to develop. Here are my favorite rigorous water cycle activities for middle school!
I always start with a reading passage and a vocabulary grid rather than a worksheet full of fill-in-the-blank definitions handed to them. When kids pull definitions for terms like sublimation, transpiration, and percolation straight from context clues in a passage, they retain it so much better than if I just hand them a glossary.
I like layering in the less-obvious processes here, too. Most kids know evaporation and precipitation cold by middle school, but sublimation and percolation are usually new, and they’re great vocabulary to build rigor into an otherwise “easy” unit.
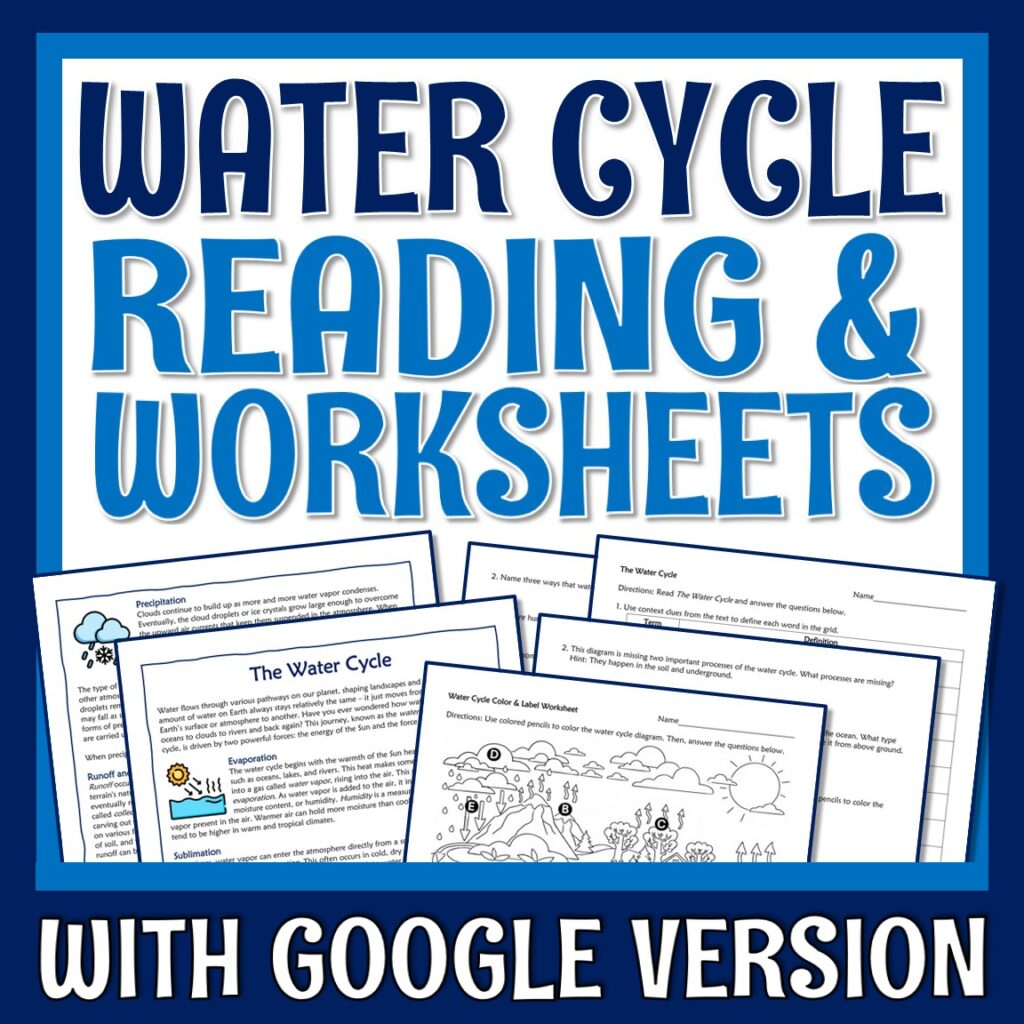
Once vocabulary is solid, I move into diagram-based questions. I love using diagrams of models of the water cycle instead of diagrams of the water cycle itself (as in, in nature). Kids have to identify which labeled part represents which process of the water cycle – and it’s a little challenging! They really have to apply their understanding of different water cycle processes because it isn’t in a context they have seen before.
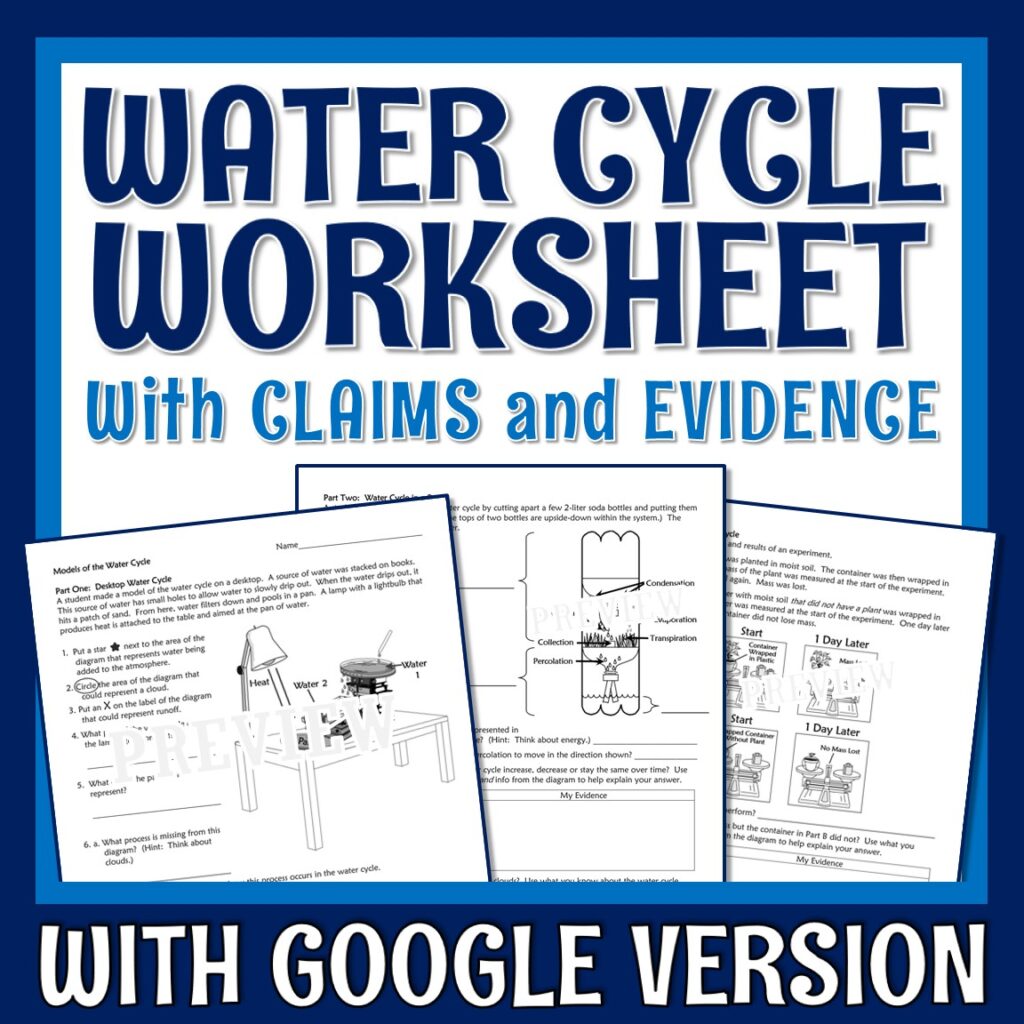
The best way to add rigor to any unit is to add elements of data analysis and Claims/Evidence/Reasoning.
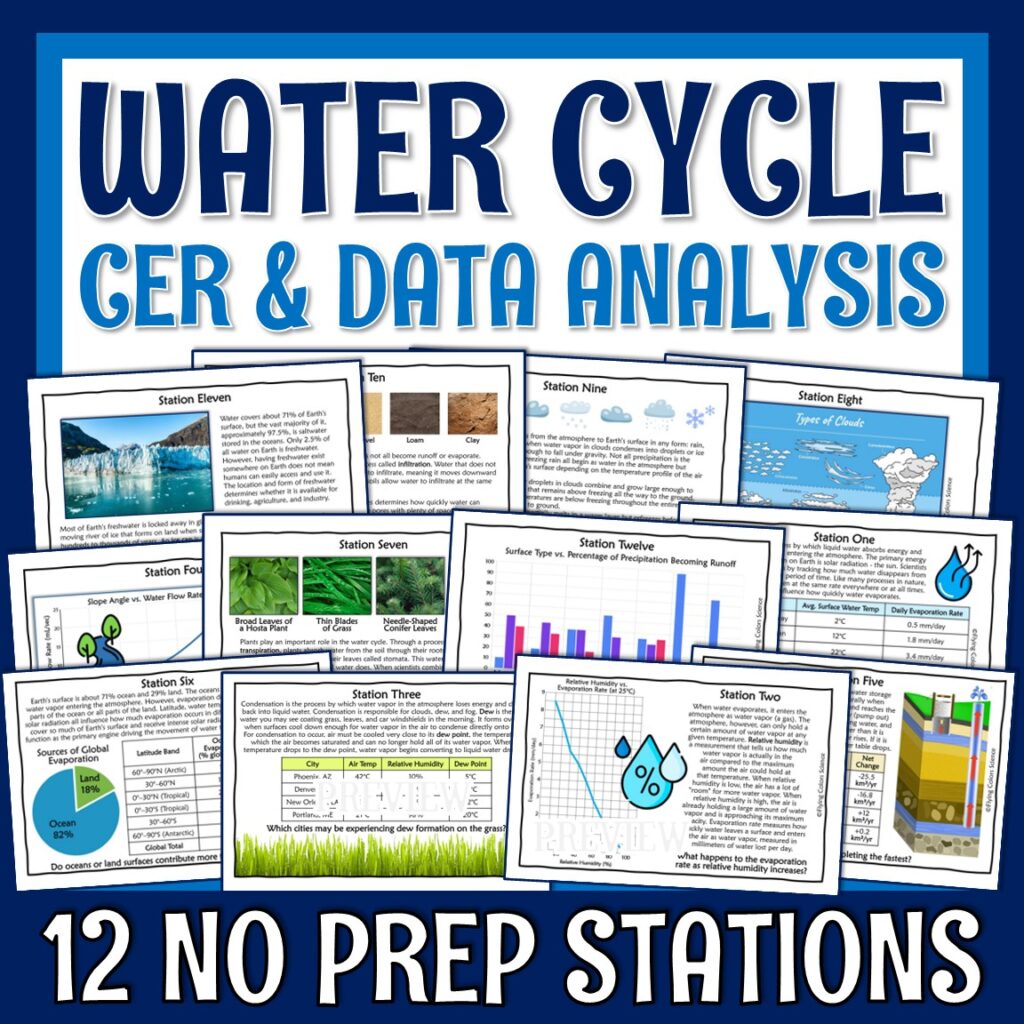
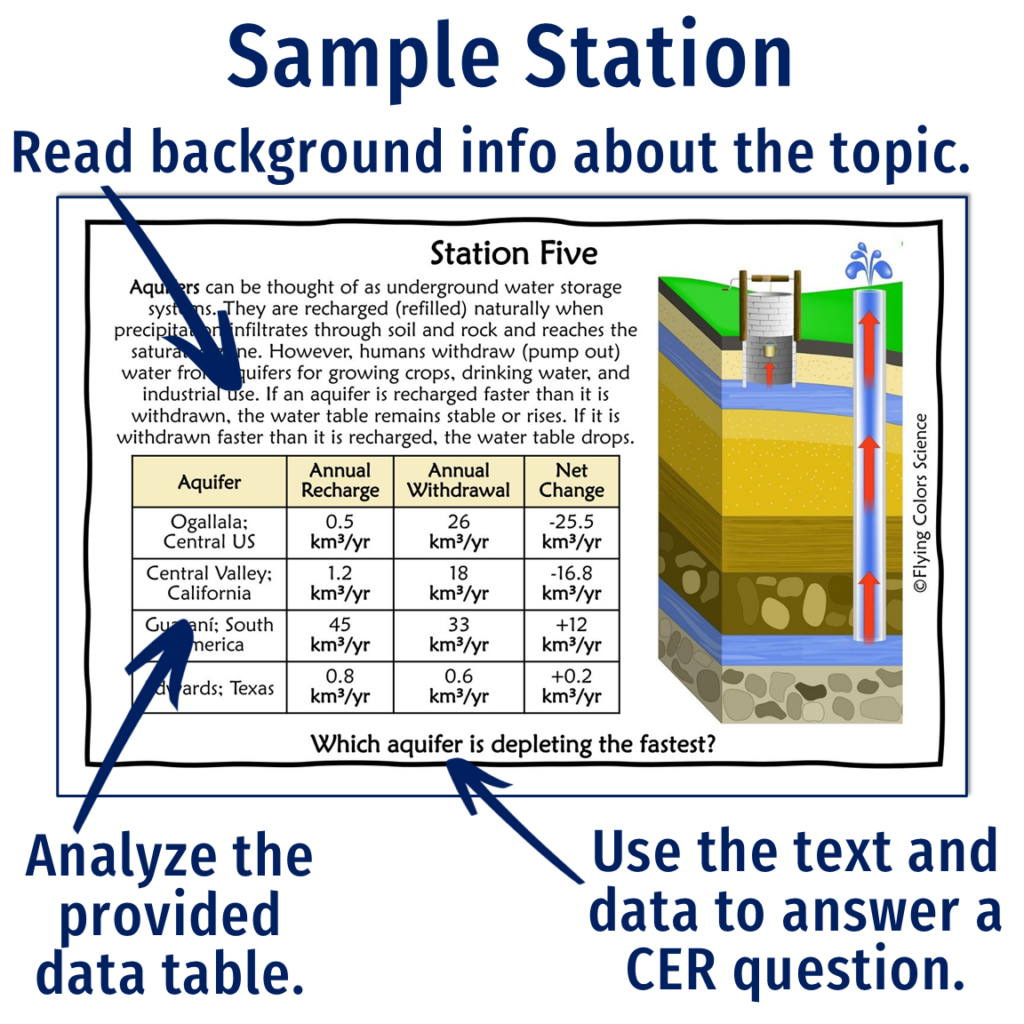
I set up data stations around the room. Each station gives students a short paragraph and a data table. That data are things like evaporation rates at different ocean temperatures, dew point vs. air temperature in different cities, or how surface type affects how much rainfall becomes runoff. Kids rotate through, and at each stop they answer a question in the Claim, Evidence, and Reasoning format using the data table.
It’s a great way to sneak in cross-curricular skills like reading graphs and interpreting tables, which our kids desperately need more practice with, while staying squarely inside the water cycle standard!
Every water cycle Pinterest board is full of the “put a wet paper towel in a Ziplock baggie and tape it to the window” activity. It’s fine as a five-minute demo, but it’s not enough for middle schoolers at all. There’s no data, no variables, and not much actual thinking involved. And they probably did it in elementary school, anyway.
Here’s a free upgrade that keeps the same low-prep spirit but adds real rigor:
The Great Evaporation Race
Divide your class into small groups, and assign each group one variable to test: surface area (wide shallow dish vs. narrow cup, same volume of water), temperature (room temp water vs. warm water), airflow (a small fan vs. still air), or salinity (plain water vs. saltwater). Every group starts with the exact same volume of water, measured with a graduated cylinder, and places their setup somewhere it won’t be disturbed for 2–3 days. Each day, groups measure and record how much water is left.
At the end, build a class data table on the board with every group’s variable and their results. Then have students graph the class data and answer an analysis question in CER format: Which variable had the biggest effect on evaporation rate, and why? This forces kids to compare across groups (not just within their own setup), interpret real numeric data, and connect it back to the actual physics of evaporation (heat energy, surface area, and humidity) instead of just watching condensation collect on plastic. It’s essentially a mini experimental design unit hiding inside a water cycle activity, and it sets kids up beautifully for talking about real evaporation data (like ocean evaporation rates or desalination) later.
Once students have a solid grip on the cycle itself, I like pivoting to the real-world connection of freshwater scarcity. Only a tiny fraction of Earth’s water is freshwater is actually accessible to us, and most middle schoolers have never really sat with that fact. From there, it’s a natural jump into engineering solutions such as desalination, filtration, and especially the solar still, which uses nothing but evaporation and condensation to turn contaminated or salty water into something drinkable.
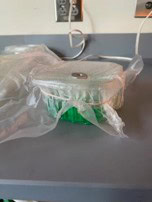
Building an actual solar still out of a plastic container, plastic wrap, and a couple of pennies to create a low point for water to drip into a cup is one of the best “aha” moments I get all year. Not only do kids build a working model of they water cycle, they ae also solving a real human problem!
If you’d rather skip the planning and prep, I’ve got you covered! My Water Cycle Complete Unit includes everything above (and more), ready to print or assign digitally:
This COMPREHENSIVE unit includes the following lessons:
Everything is aligned to NGSS MS-ESS2-4 and ready to print-and-go! No more scrambling to find rigorous, engaging water cycle resources at 10 p.m. the night before your unit starts. 💙