Graphing Ocean Tides Activity
$4.50
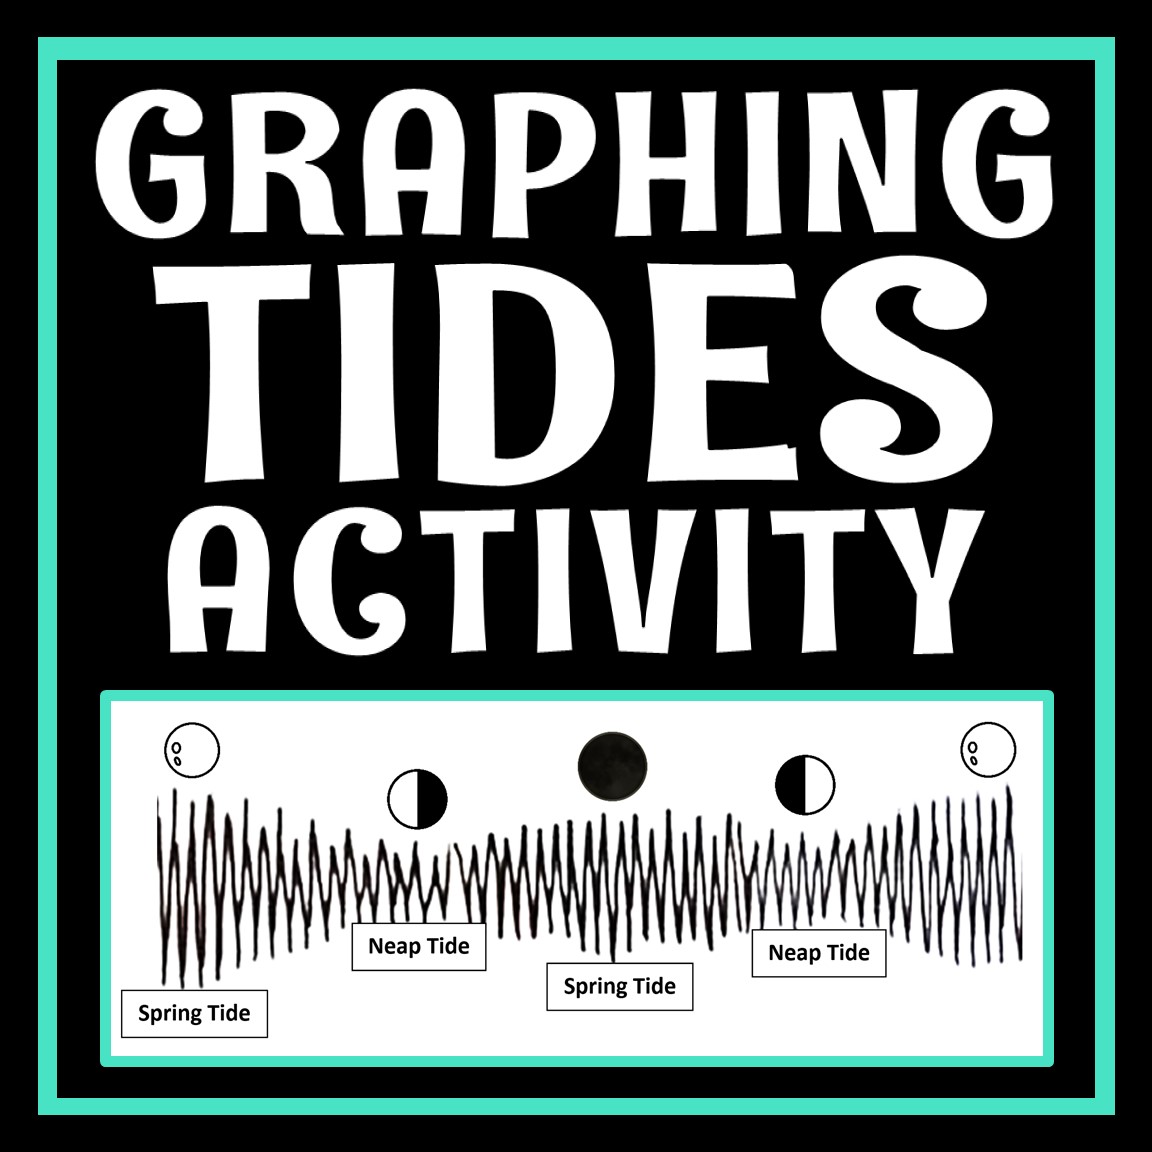
Students graph monthly and daily tides from a tide chart and make connections to the moon phases associated with spring and neap tides.
Grades 7 and Up
Get this resource at a discount in our Moon & Tides Activity Bundle!
Students generate a graph to discover the patterns in tides and how they relate to the moon. They’ll gain a deeper understanding of the relationship between the moon and tides.
Lesson Outline:
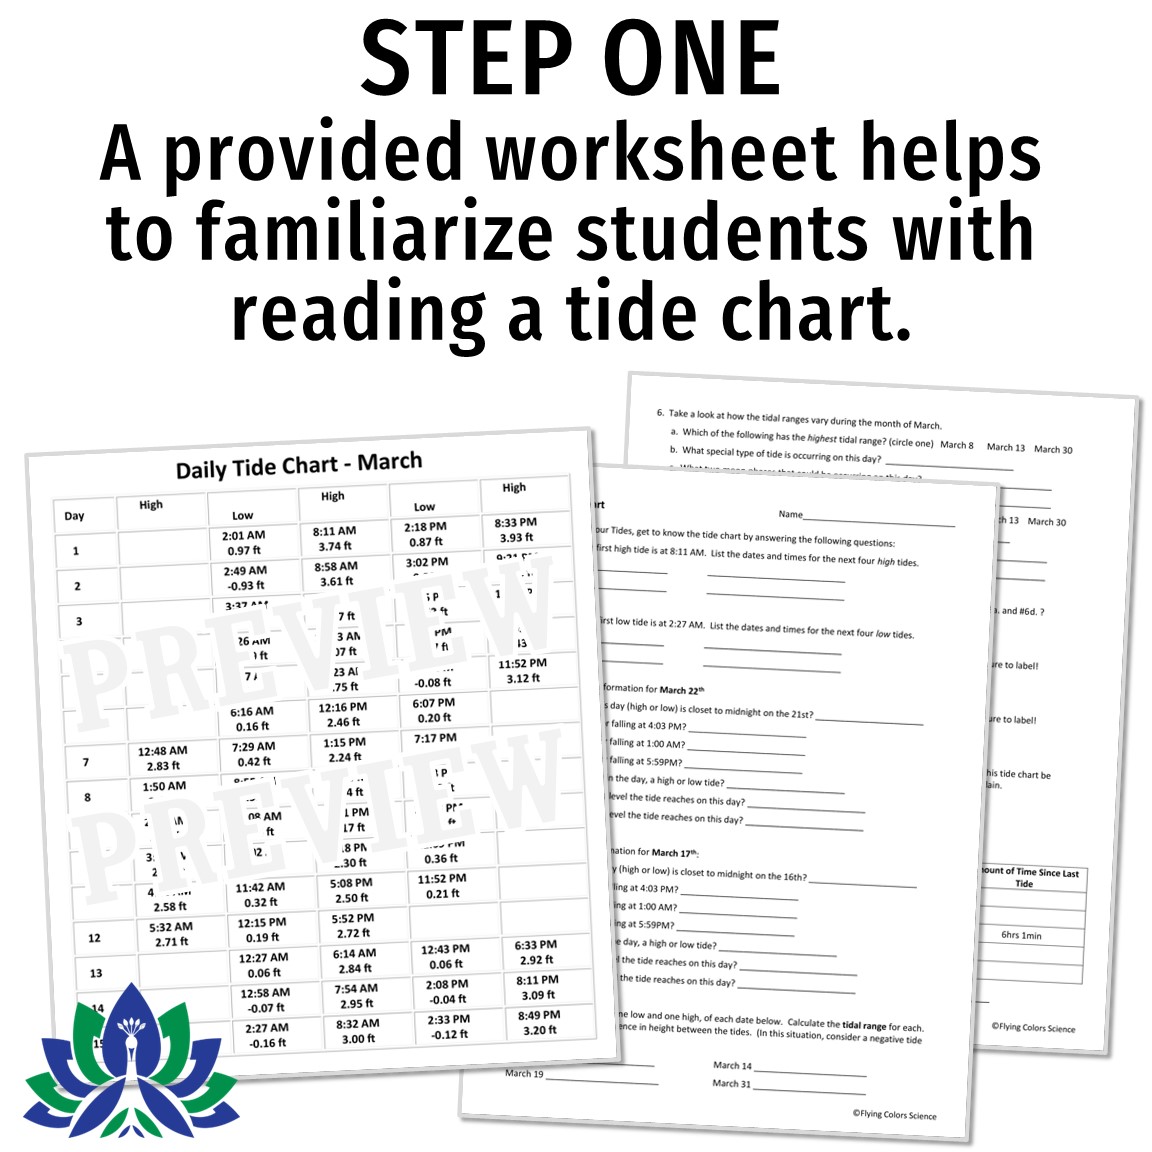
- PRACTICE using a tide chart. This familiarizes kids with reading and working with a tide chart.
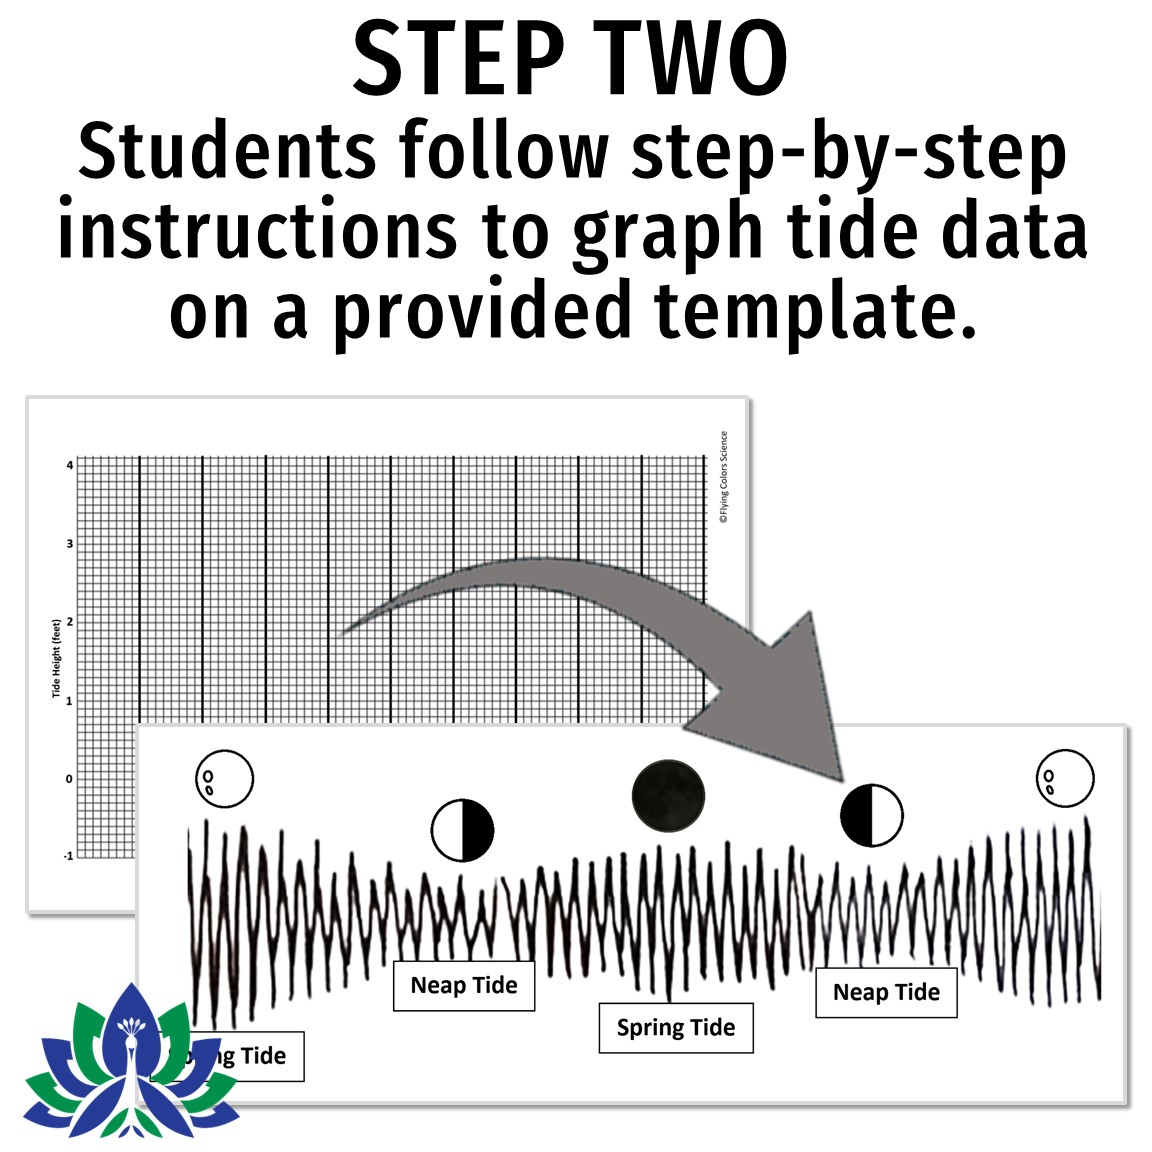
- GRAPH the tide chart data for one month. We find it helpful to make groups of three, so each student only graphs one-third of the data. Students combine their graphs to make one long tide graph.
- WORK UP the graph by adding neap and spring tide labels and moon phases.
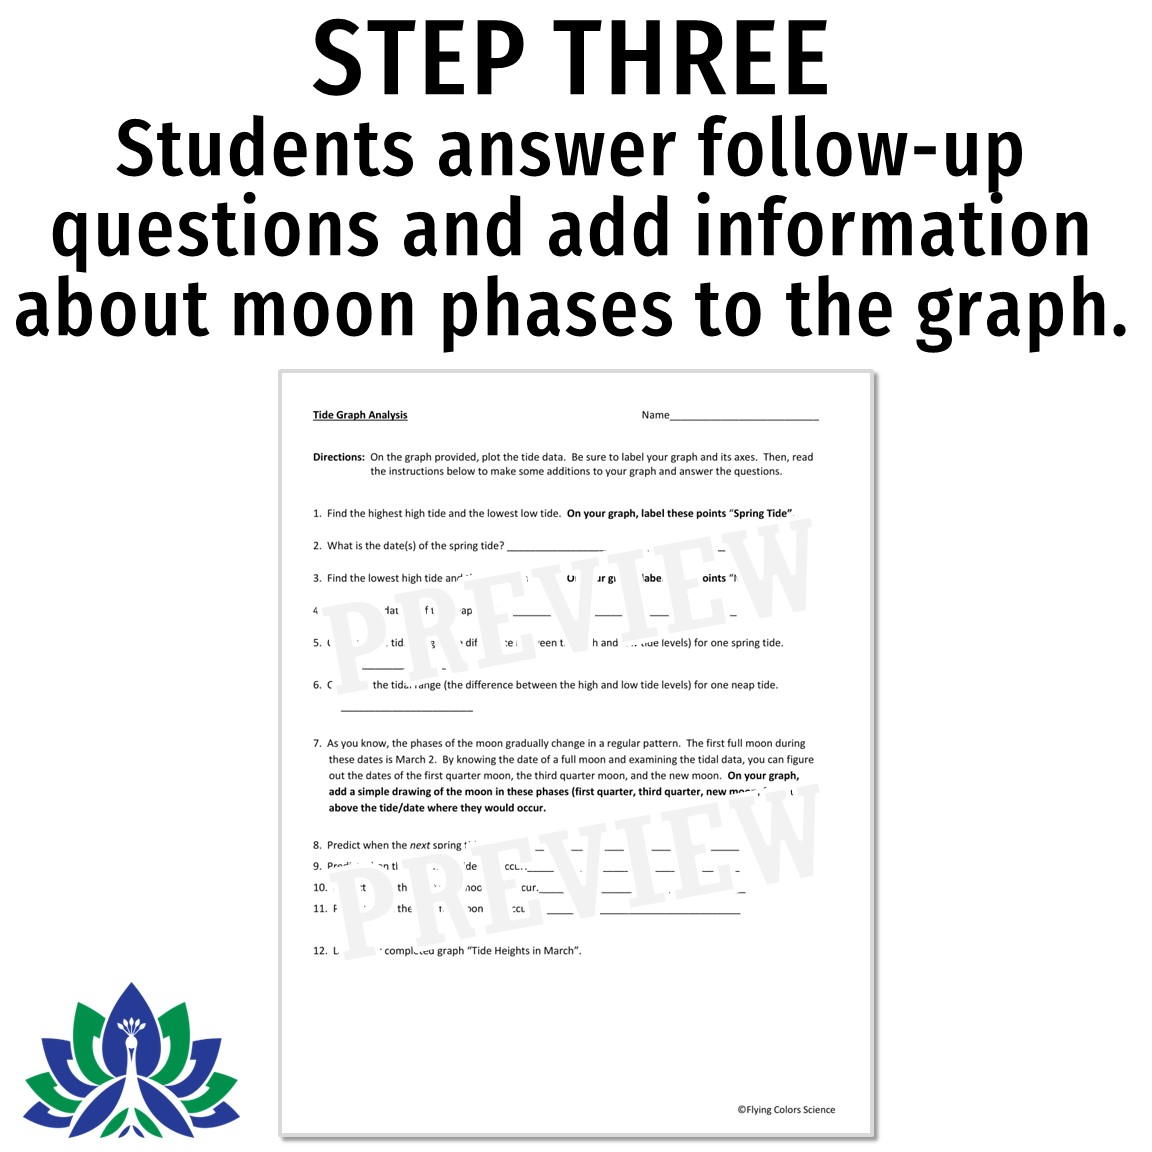
- ANSWER follow-up analysis questions.
Please note: If you would like to have your students practice reading a tide chart without the graphing part, we also off this Reading a Tide Chart Worksheet.
Provided Documents:
- Using a Tide Chart worksheet
- Daily Tide Chart (1 page – make one class set and REUSE)
- Tide Graph Analysis
- Tide Graph Blank
Teacher Notes:
- ANSWER KEY INCLUDED.
- Please note that this resource is not editable.
- NGSS Standards Covered: MS-ESS1-2, MS-PS2-4, HS-ESS1-4
- NGSS Science & Engineering Practice: Analyzing and interpreting data
- NGSS Science & Engineering Practice: Using mathematics and computational thinking
- Check out more resources in the moon and tides section of our shop!
Be the first to review “Graphing Ocean Tides Activity” Cancel reply



Reviews
There are no reviews yet.