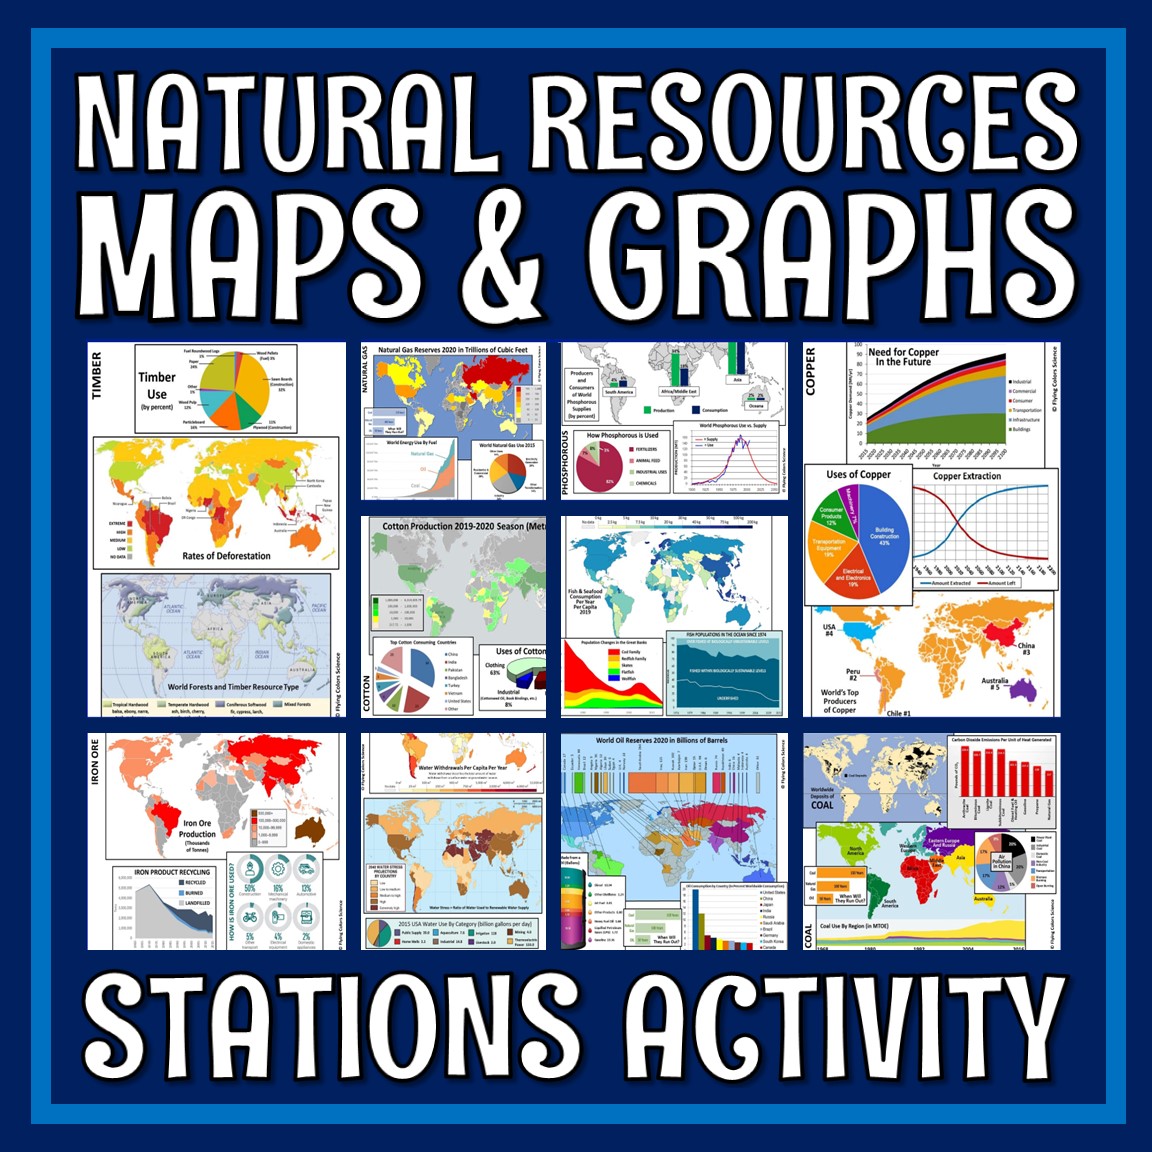
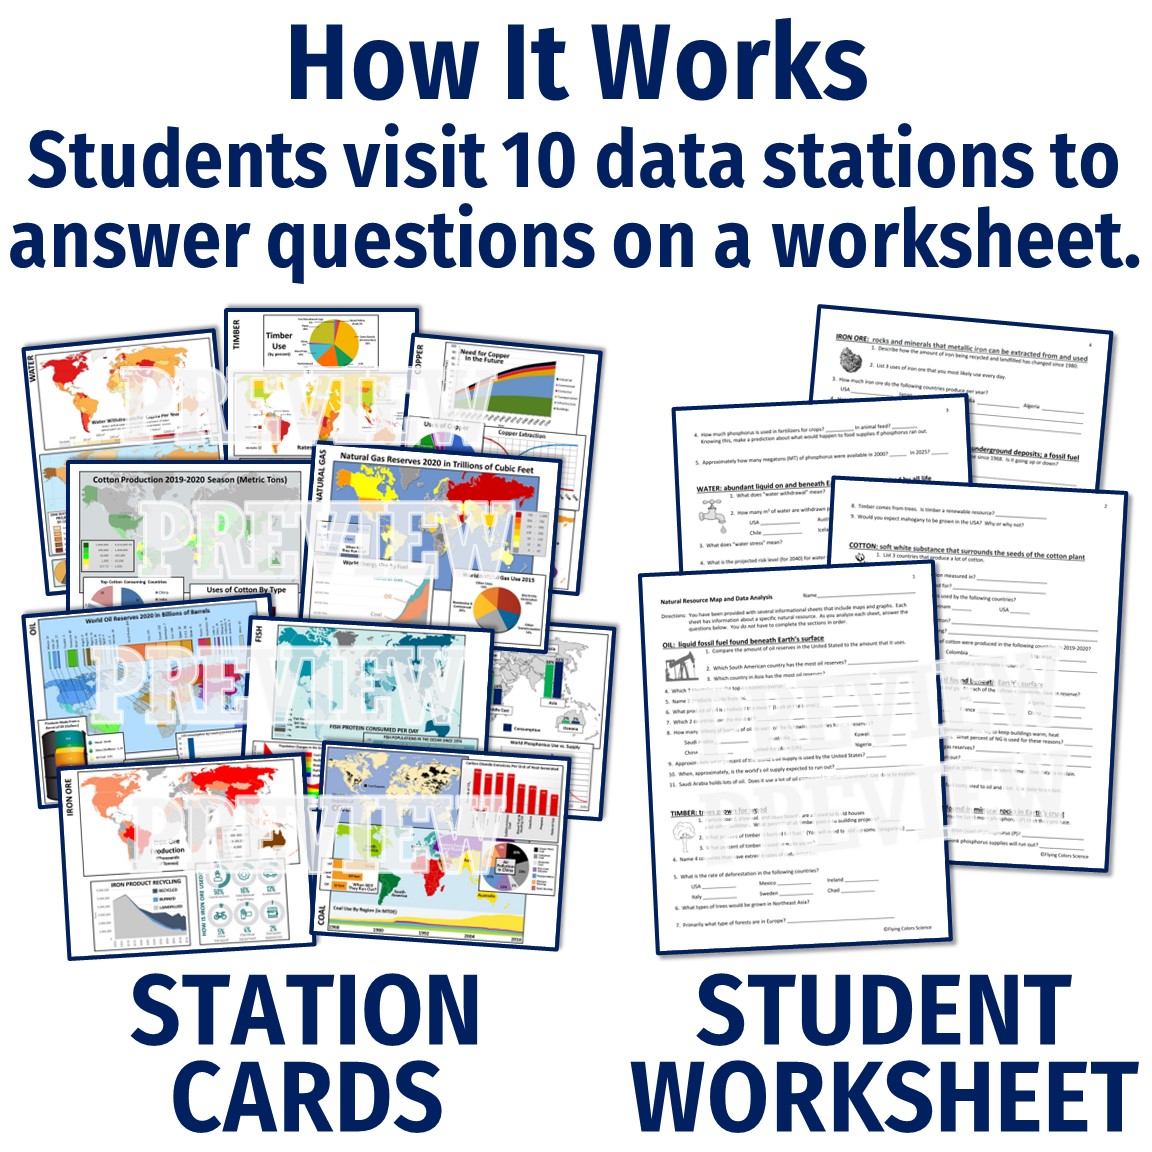
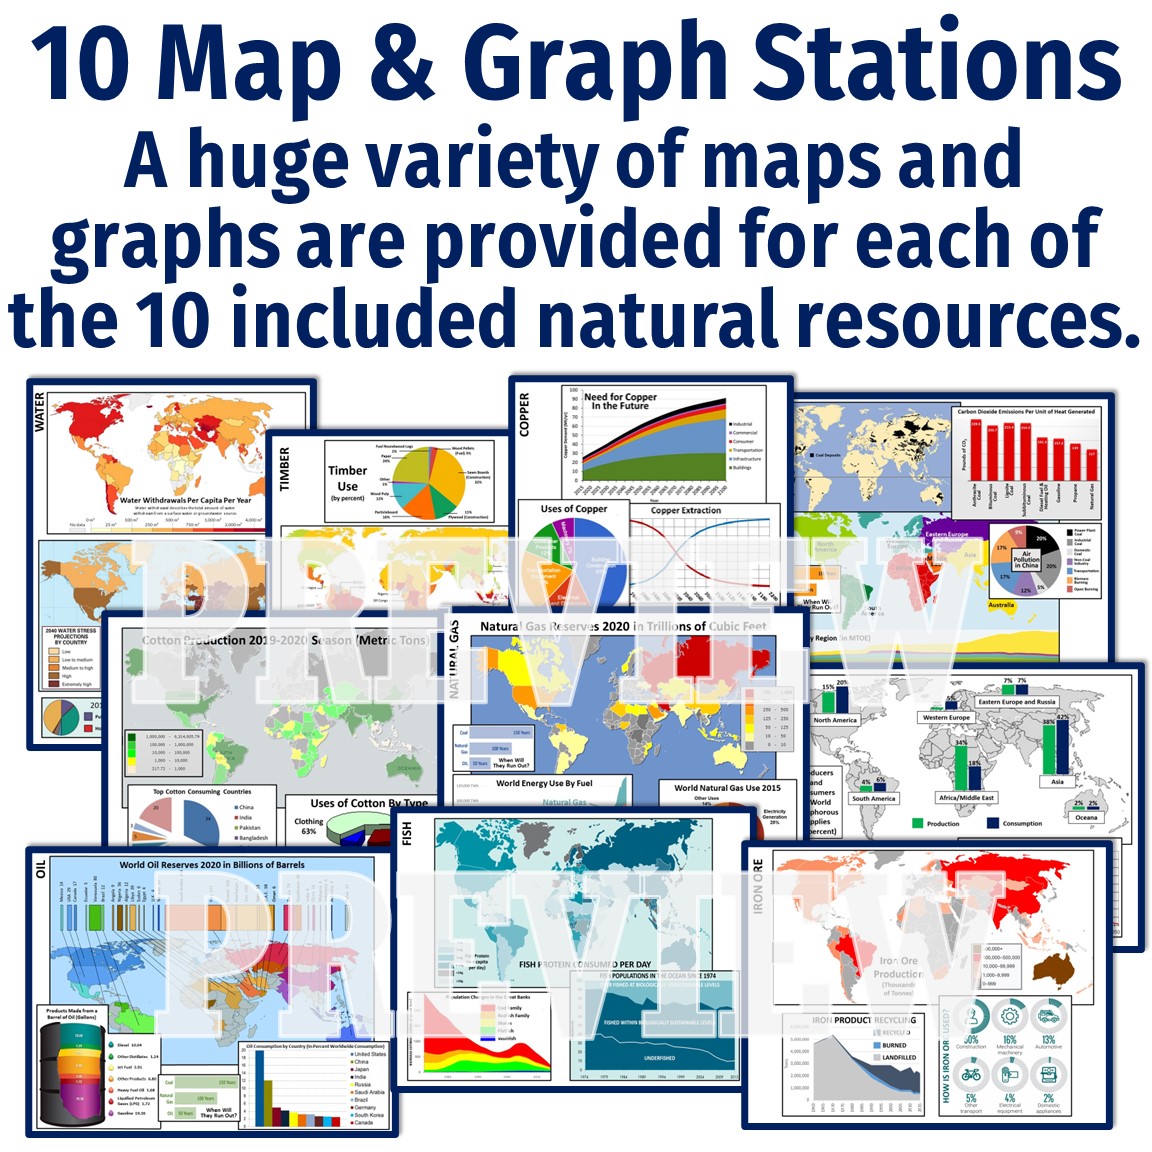
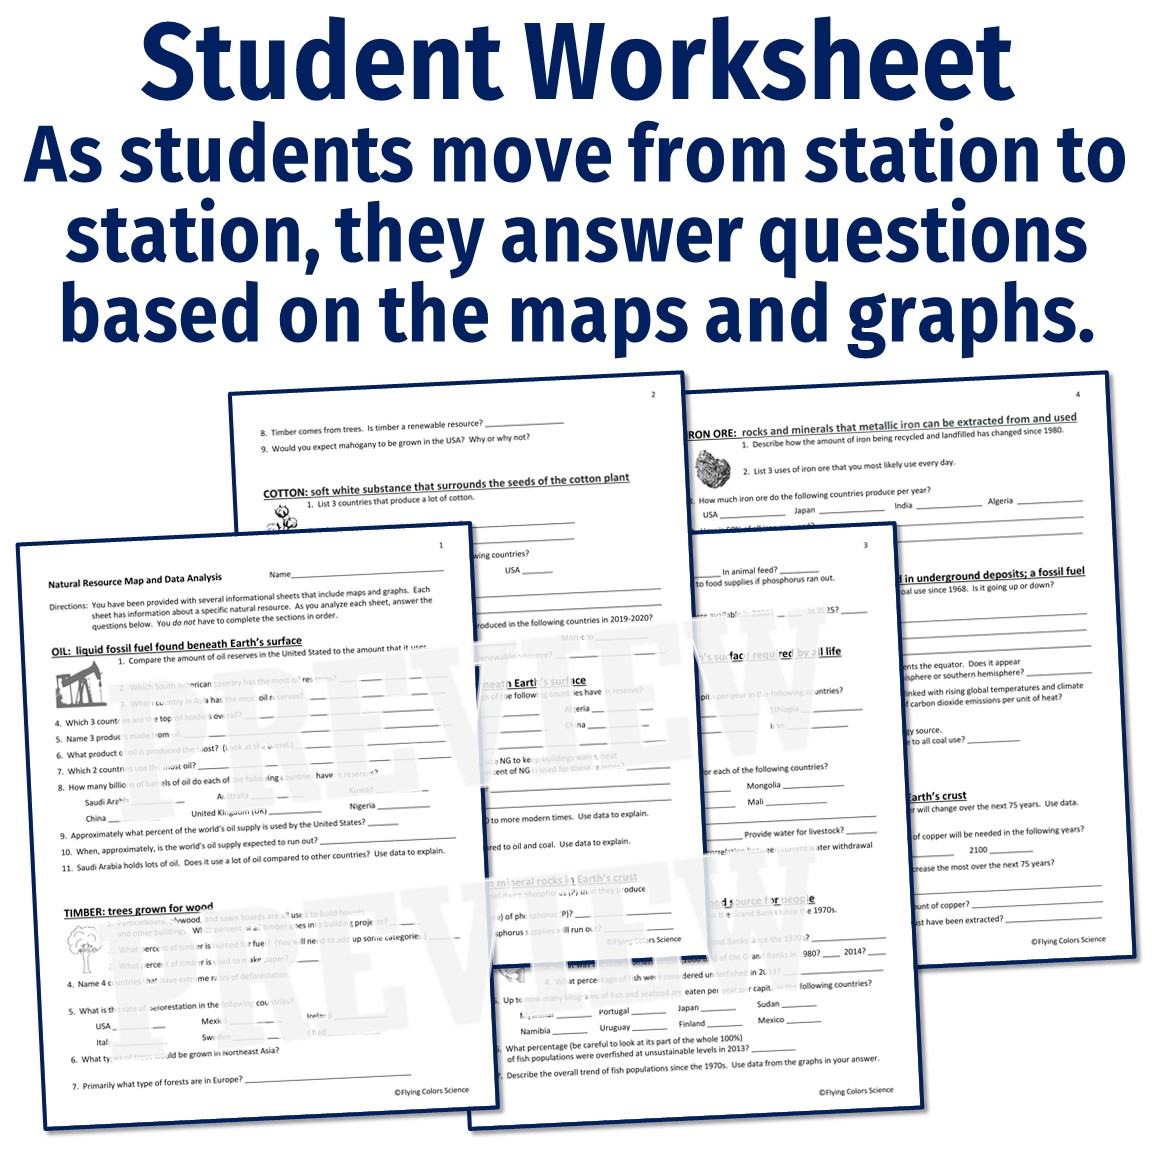
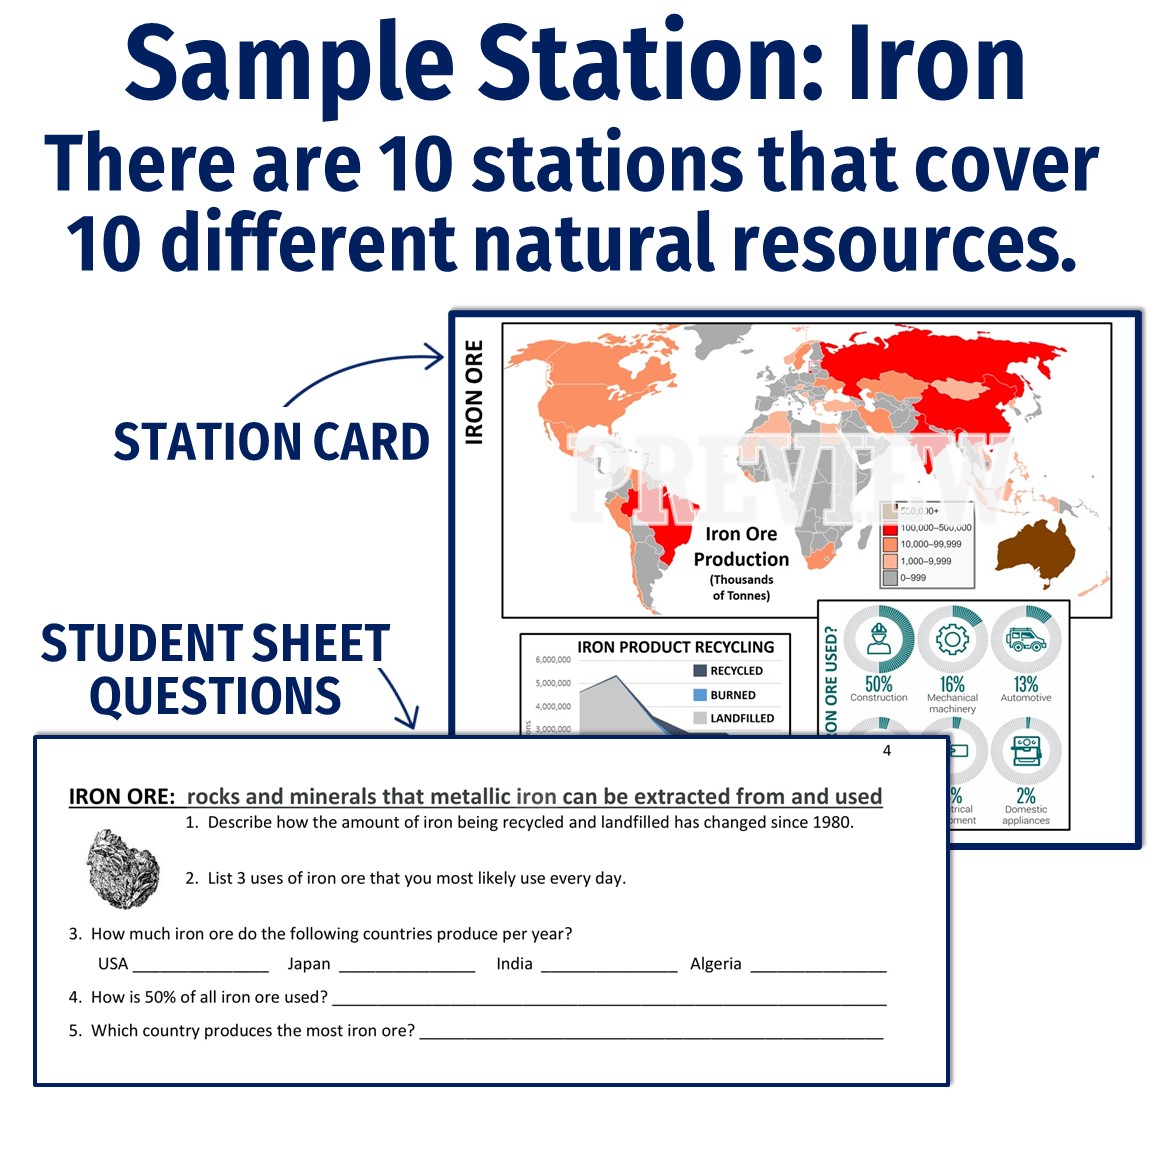
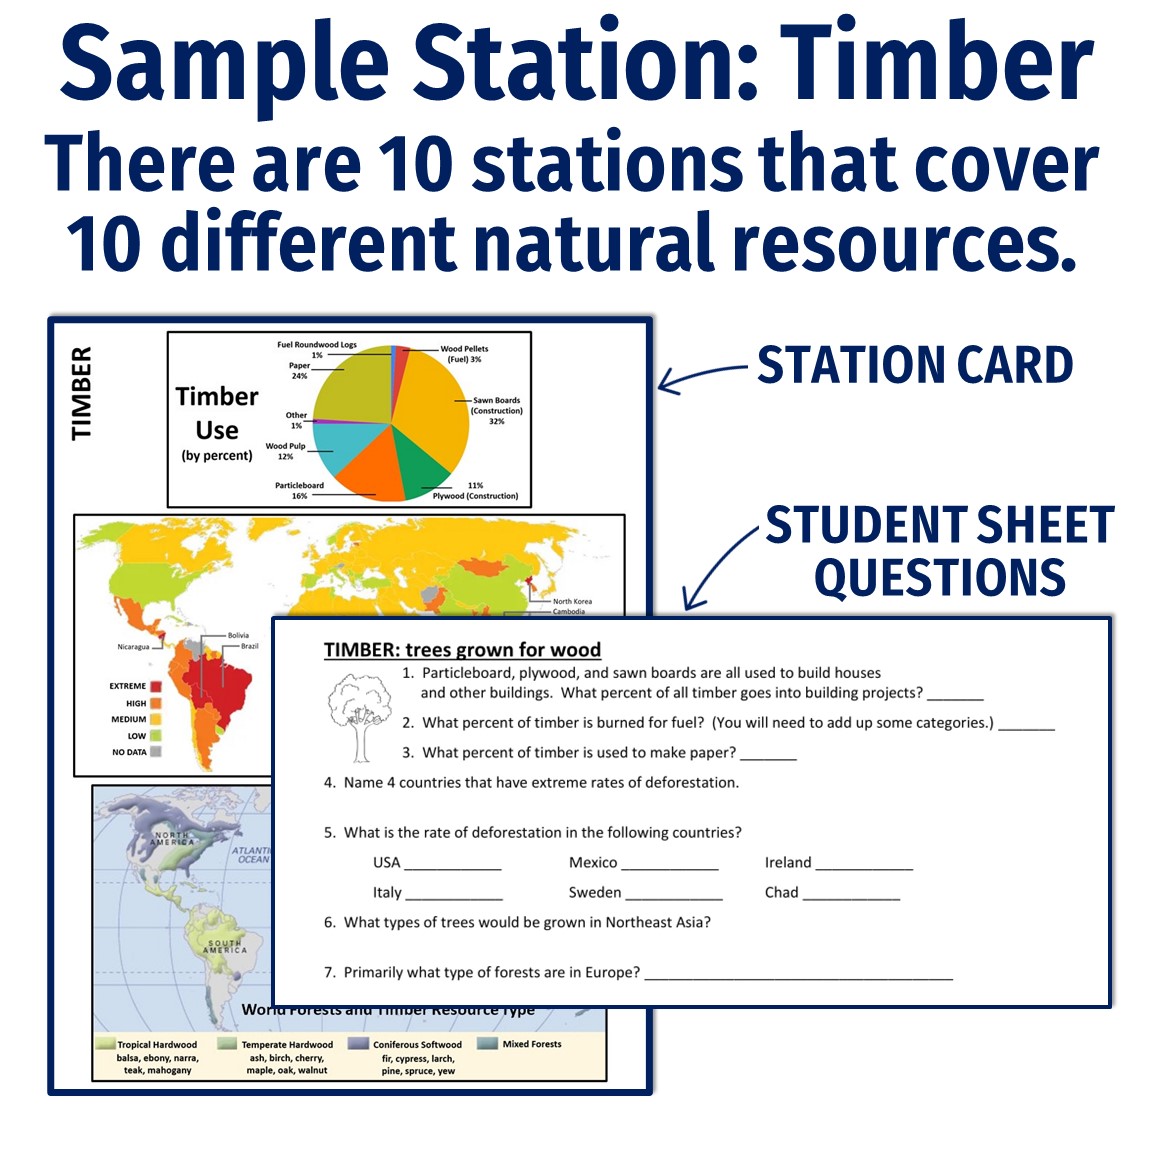
In this uneven distribution of natural resources activity, students will analyze MAPS and GRAPHS of resource distribution and use. This is the perfect activity to cover NGSS MS-ESS3-1!
Includes both PRINT and GOOGLE SLIDES versions!
⭐ Get this resource at a discount in our Uneven Distribution of Natural Resources Unit!
This document includes:
EASY PREP and easy to assign! Only 1 color copy per station is required (10 color pages total). Students can circulate throughout the stations, so there is no need to make color copies for each student. Each student or group needs one black-and-white answer sheet each.
Teacher Notes:
Related Standards:
$6.00
| Cookie | Duration | Description |
|---|---|---|
| cookielawinfo-checkbox-analytics | 11 months | This cookie is set by GDPR Cookie Consent plugin. The cookie is used to store the user consent for the cookies in the category "Analytics". |
| cookielawinfo-checkbox-functional | 11 months | The cookie is set by GDPR cookie consent to record the user consent for the cookies in the category "Functional". |
| cookielawinfo-checkbox-necessary | 11 months | This cookie is set by GDPR Cookie Consent plugin. The cookies is used to store the user consent for the cookies in the category "Necessary". |
| cookielawinfo-checkbox-others | 11 months | This cookie is set by GDPR Cookie Consent plugin. The cookie is used to store the user consent for the cookies in the category "Other. |
| cookielawinfo-checkbox-performance | 11 months | This cookie is set by GDPR Cookie Consent plugin. The cookie is used to store the user consent for the cookies in the category "Performance". |
| viewed_cookie_policy | 11 months | The cookie is set by the GDPR Cookie Consent plugin and is used to store whether or not user has consented to the use of cookies. It does not store any personal data. |