

Need some population ecology activities and lessons that pop?
Add REAL-WORLD connections to your populations lessons to take engagement to the next level!
I’ll show you how!
First off – the why. There are several NGSS standards that relate to population ecology, so it’s a “must get to” topic. These middle school NGSS standards are the most relevant:
To begin the population ecology unit, I frontload the concepts by assigning my Population Ecology Reading. It’s an easy way to introduce students to each of the major themes in the unit. They’ll read the article and then answer some text-dependent questions. Just assign and go! No textbook needed. Done and done.

Want to spark maximum curiosity in your students right off the bat? Animals are always a hit (and an instant real-world connection)!
While cute animals are definitely the “hook,” this Limiting Factors of Endangered Species Activity is sneakily rigorous because it gets students thinking critically about why populations decline.
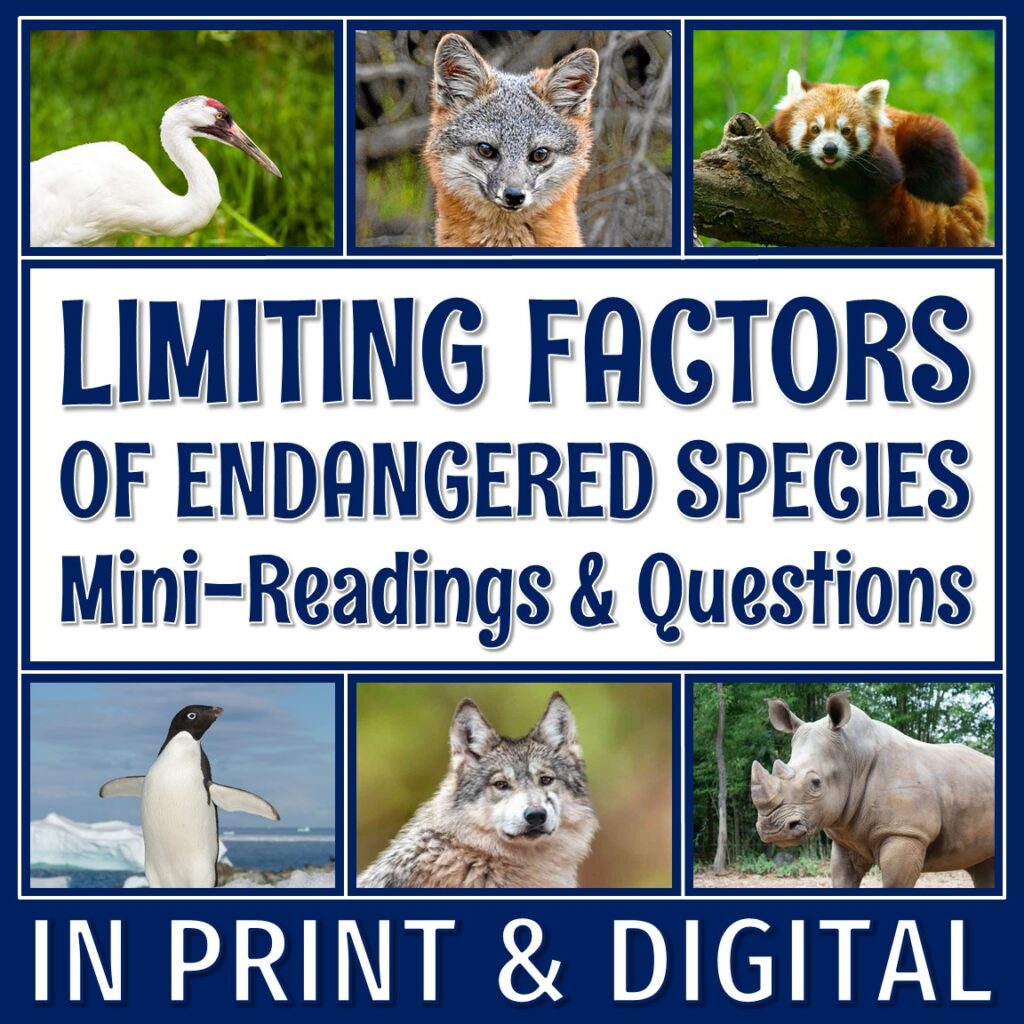
For example, students read about the Island Fox, a tiny fox species that only lives on a few islands off the coast of California. Their population crashed due to Golden Eagles, which moved in after Bald Eagles declined in the 1960s. The Golden Eagles saw exponential growth because, unlike Bald Eagles, which prefer fish, Golden Eagles saw these cat-sized foxes as snack-sized prey. The result? The Island Fox population plummeted to just 15 individuals by the year 2000.
The rigor comes in when, after reading about this real-world case (and lots more just like it), students must identify the limiting factors from the information provided.
Real-world connection for the win!
Do you, like me, find that carrying capacity is one of the trickiest concepts for students to grasp? Without a concrete example, it’s just an abstract idea. That’s why I created this fun Carrying Capacity Activity.

Students learn about a population of mink introduced to an island, then graph their population growth over time. The data helps them visualize carrying capacity in action. It’s always a lightbulb moment! Plus, kids get super invested in what happens to the mink – hello, real-world connection!
And – bonus for you as their teacher – they’re practicing graphing skills.
If your students have more advanced graphing skills, check out Biology Corner’s lesson about the classic deer case study from Arizona’s Kaibab Plateau. Kids will graph and interpret real historical data (there’s that real-world connection again!) to understand what happens when humans interfere with natural predator-prey relationships. In this case, humans eliminated predators and banned hunting, which led to deer overpopulation, overgrazing, and ultimately mass starvation.
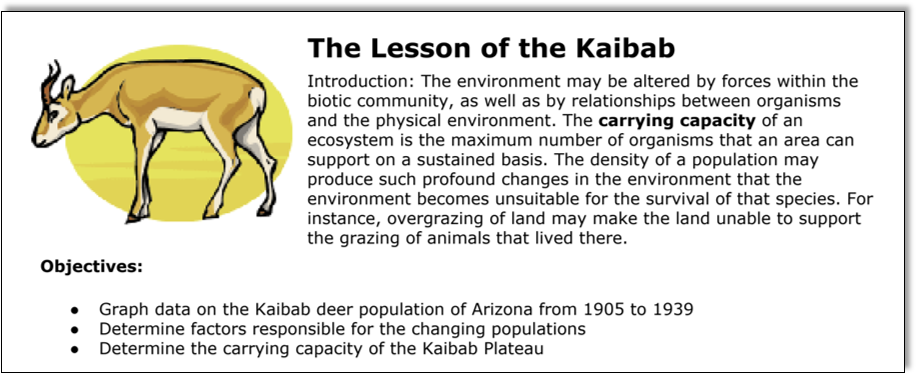
Similar to my mink lesson, students graph carrying capacity. However, in this version, kids have to make the graph themselves, so it’s a little bit more challenging. Challenging is good!
And speaking of graphing – let’s be real – graphing skills are rough for today’s students. Many struggle with reading a graph, let alone creating one. However, standardized science tests love to throw graphs, often population graphs, at students, so I try to give kids as much practice analyzing graphs as I can.

That’s where my Population Graphs Worksheet comes in. It’s packed with simple population graphs to help students gain confidence in reading and analyzing data AND extends their learning about birth rate, death rate, population dynamics, population growth, and population density.
A while back, an organization called National Agriculture in the Classroom contacted me about spreading the word about their programs. I dug in a little bit, and I can honestly say they’re great! I’m going to write more about them another time, but for now, in a nutshell, I’ll tell you that they make actually useful and actually doable free lessons that relate science topics to agriculture.

And they have a GREAT lesson on human population growth! And it’s FREE!
In this lesson sequence, students will:
I mean, can you get more of a real-world connection than that?! Students don’t just learn about population growth as a number – they explore how it connects to farming methods, food distribution, and technological development.
✓ Real-world connection, check!
You can’t beat watching something grow under your own two eyes for a real-world connection!
PBS Learning Media offers an AWESOME and free Population Growth Lab you should try! What’s so cool about this lab is that not only does it cover populations topics, but it makes a tie-in to invasive species, too!
In the first part of the activity, students grow duckweed over a few weeks. They observe what happens to the population as it is allowed to grow without predators or competition. In the second part, students watch (provided) videos about invasive species that spread quickly and threaten other naturally occurring species. Students then apply what they learned from their duckweed experiment to develop a proposal for controlling the growth of an invasive species in their own community.
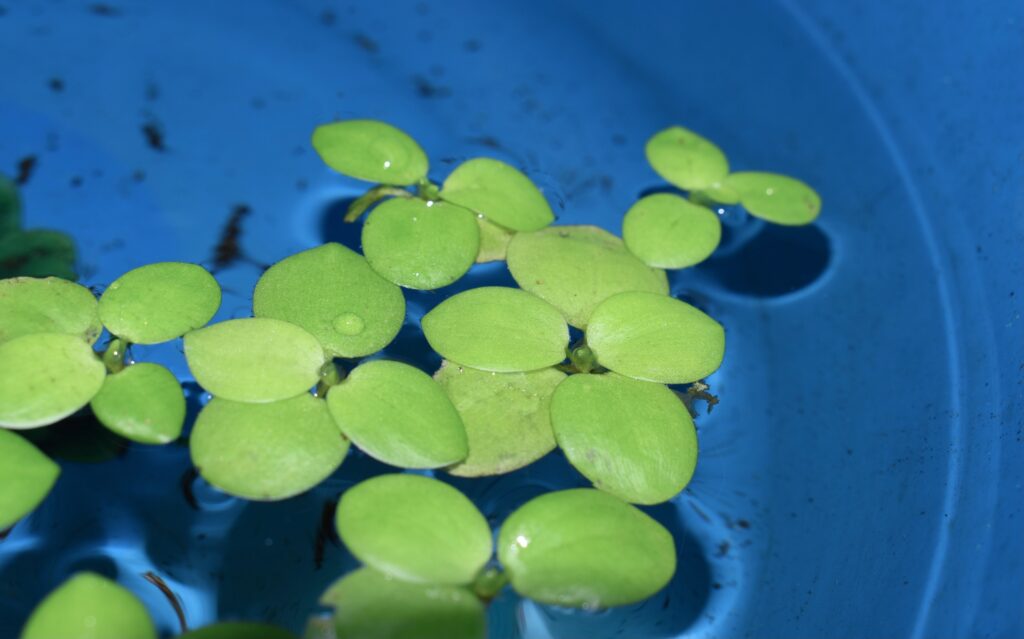
It’s a really cool lab that brings in not only populations concepts but also invasive species and human impact on the environment.
Real-world connections all the way around!
Check it out HERE to see if it is a good fit for your classroom. It’s free, so it’s worth a look.
Instead of doing all the planning and prepping, and organizing for this unit, would you rather just have it all laid out for you? I’VE GOT YOU!
Check out my Population Ecology Bundle – it has all the populations lesson plans you’ll need! Print and go. (Or even easier – use the digital options!)

By using engaging, REAL-WORLD examples, we can help students see how population ecology isn’t just textbook knowledge – it’s happening all around them.
As an Amazon Associate I earn from qualifying purchases.