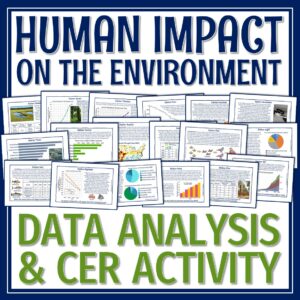
Looking for a more RIGOROUS human impact on Earth lesson? In this human population and impact on Earth’s systems activity, students will practice SCIENCE GRAPHING SKILLS and answer questions in the CLAIMS-EVIDENCE-REASONING format as they extend their learning about human population growth and its impact on the environment!
⭐ Get this activity at a HUGE DISCOUNT in my HUMAN IMPACT UNIT! ⭐
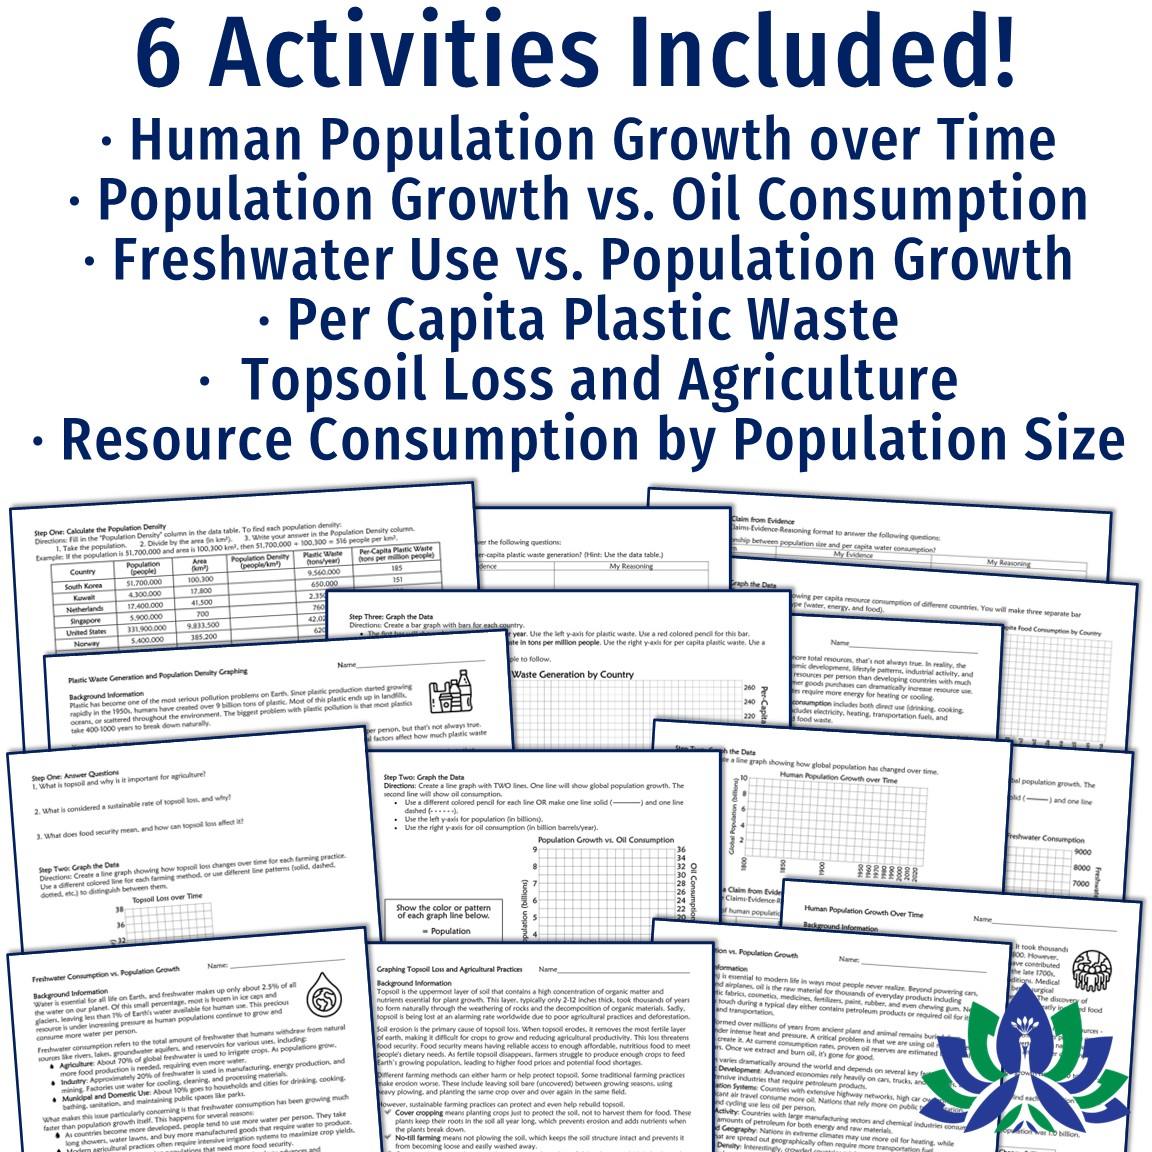
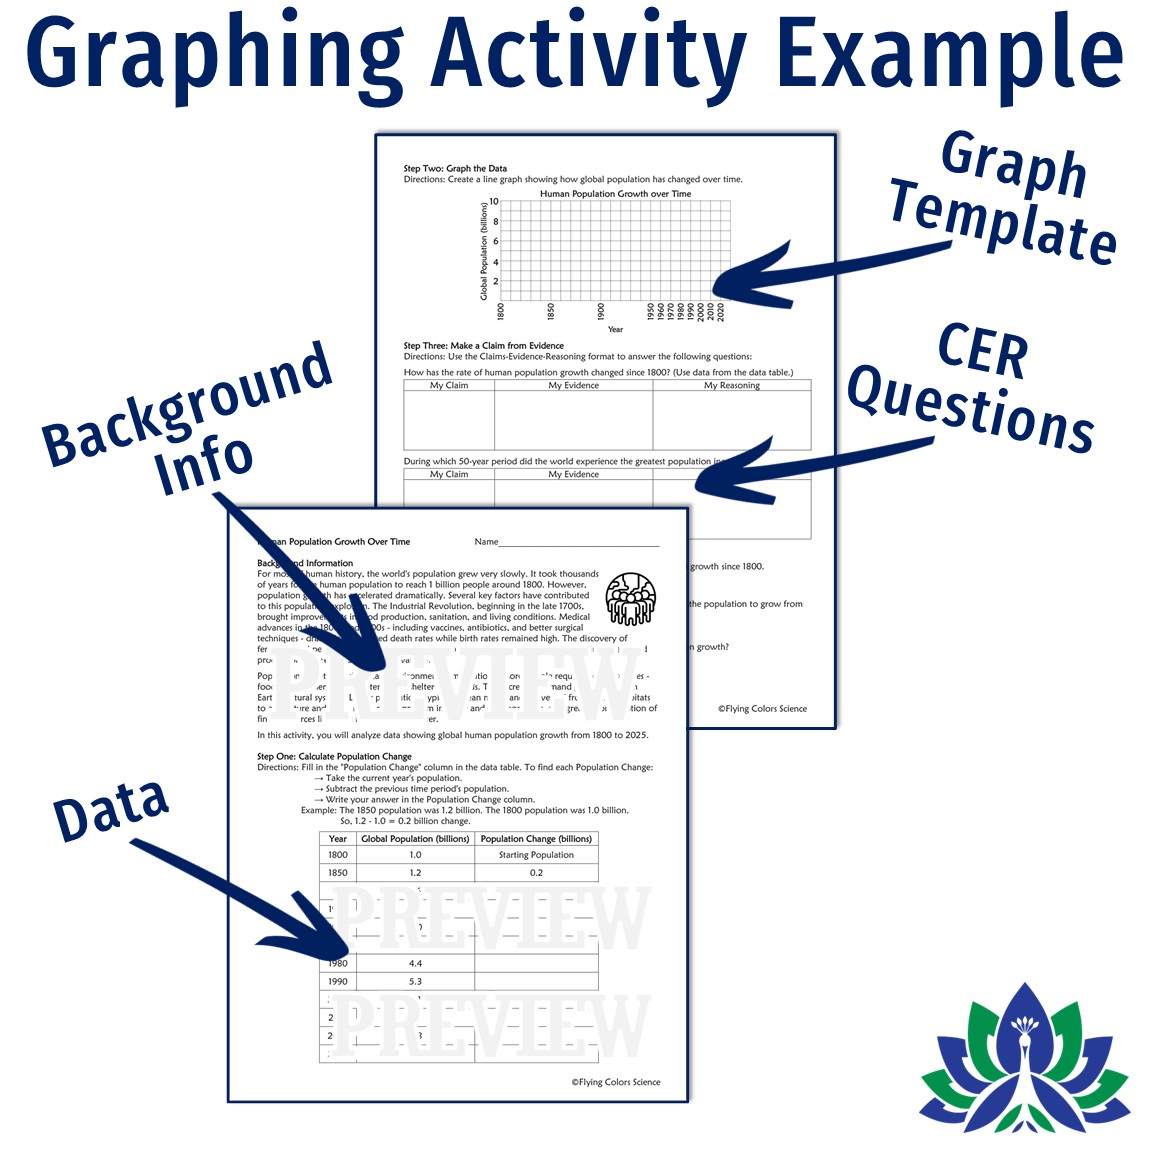
There are SIX graphing activities included. They can be used together or completely independently of each other. They would be great as stations! The format of each activity is the same:
Six Graphing Activities Included:
Teacher Notes:
Related Standards:
$4.99
| Cookie | Duration | Description |
|---|---|---|
| cookielawinfo-checkbox-analytics | 11 months | This cookie is set by GDPR Cookie Consent plugin. The cookie is used to store the user consent for the cookies in the category "Analytics". |
| cookielawinfo-checkbox-functional | 11 months | The cookie is set by GDPR cookie consent to record the user consent for the cookies in the category "Functional". |
| cookielawinfo-checkbox-necessary | 11 months | This cookie is set by GDPR Cookie Consent plugin. The cookies is used to store the user consent for the cookies in the category "Necessary". |
| cookielawinfo-checkbox-others | 11 months | This cookie is set by GDPR Cookie Consent plugin. The cookie is used to store the user consent for the cookies in the category "Other. |
| cookielawinfo-checkbox-performance | 11 months | This cookie is set by GDPR Cookie Consent plugin. The cookie is used to store the user consent for the cookies in the category "Performance". |
| viewed_cookie_policy | 11 months | The cookie is set by the GDPR Cookie Consent plugin and is used to store whether or not user has consented to the use of cookies. It does not store any personal data. |