Get this graphing climate data activity at a huge discount in our comprehensive Climate Change Unit!
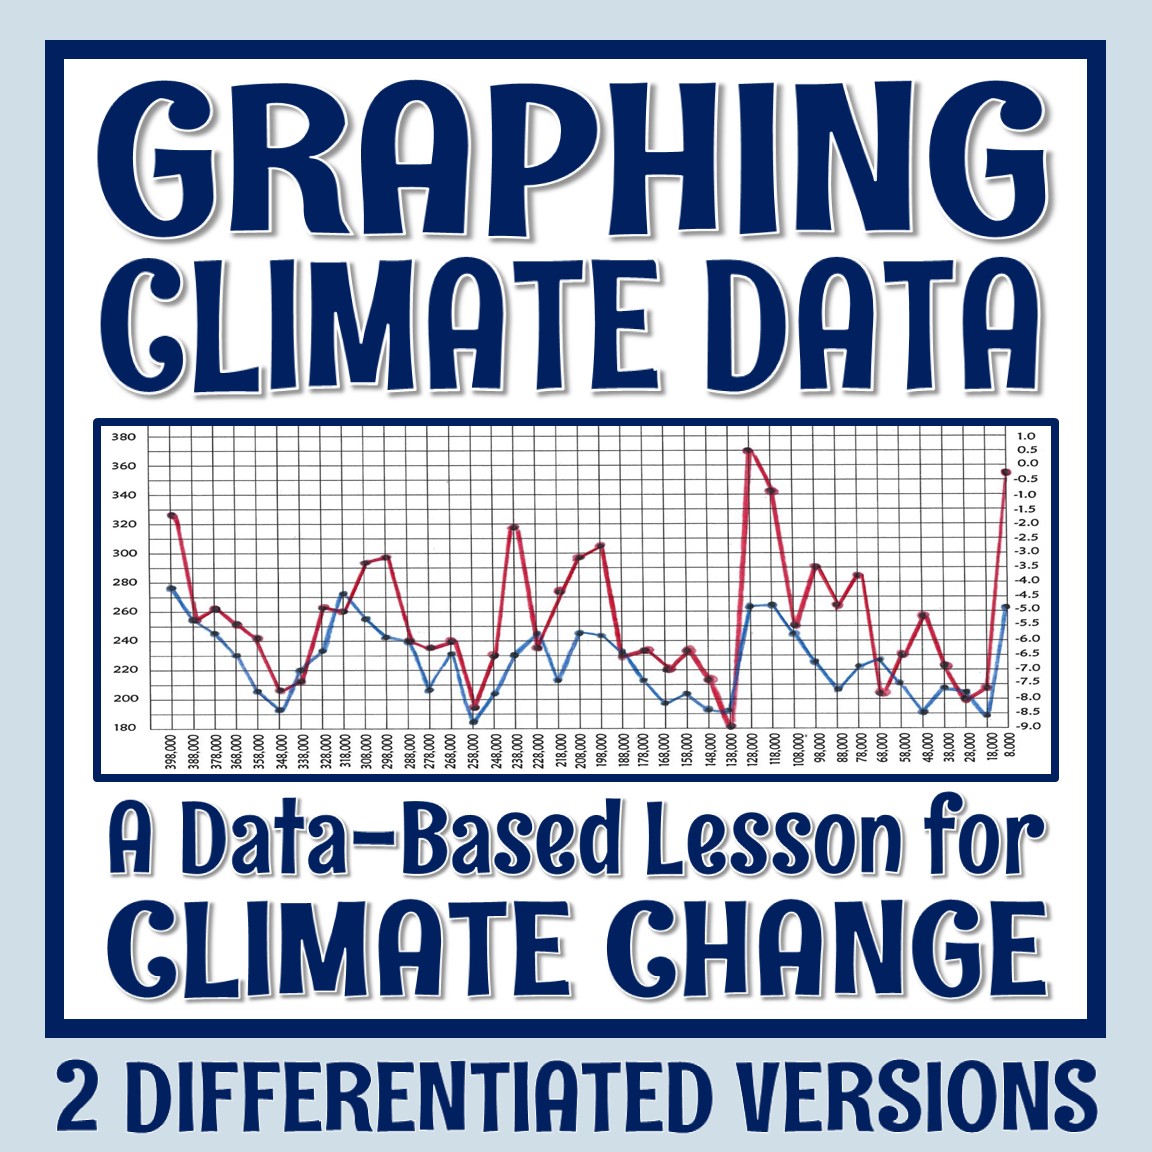
Students generate and analyze graphs using real data from both ice cores dating back 400,000 years and modern times. Students complete a detailed analysis of each graph and complete a CER section.
*** Updated in 2024!*** Now includes two differentiated versions! The standard version has less data to graph and simplified graphs. The more rigorous version has more data points and more advanced graphs.
In both versions of this activity, students will:
Resource Includes:
Looking for a simpler way to cover climate change graphs? Try this Climate Change Graphs Worksheet!
Teacher Notes:
Related Standards:


$5.99
| Cookie | Duration | Description |
|---|---|---|
| cookielawinfo-checkbox-analytics | 11 months | This cookie is set by GDPR Cookie Consent plugin. The cookie is used to store the user consent for the cookies in the category "Analytics". |
| cookielawinfo-checkbox-functional | 11 months | The cookie is set by GDPR cookie consent to record the user consent for the cookies in the category "Functional". |
| cookielawinfo-checkbox-necessary | 11 months | This cookie is set by GDPR Cookie Consent plugin. The cookies is used to store the user consent for the cookies in the category "Necessary". |
| cookielawinfo-checkbox-others | 11 months | This cookie is set by GDPR Cookie Consent plugin. The cookie is used to store the user consent for the cookies in the category "Other. |
| cookielawinfo-checkbox-performance | 11 months | This cookie is set by GDPR Cookie Consent plugin. The cookie is used to store the user consent for the cookies in the category "Performance". |
| viewed_cookie_policy | 11 months | The cookie is set by the GDPR Cookie Consent plugin and is used to store whether or not user has consented to the use of cookies. It does not store any personal data. |