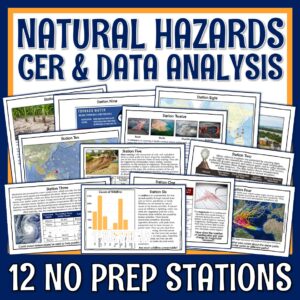
In this tracking hurricanes activity, students analyze real hurricane forecast maps to determine where a hurricane is likely to travel and which locations are at greatest risk. Perfect for a middle school weather activity or a natural hazards and disasters unit!
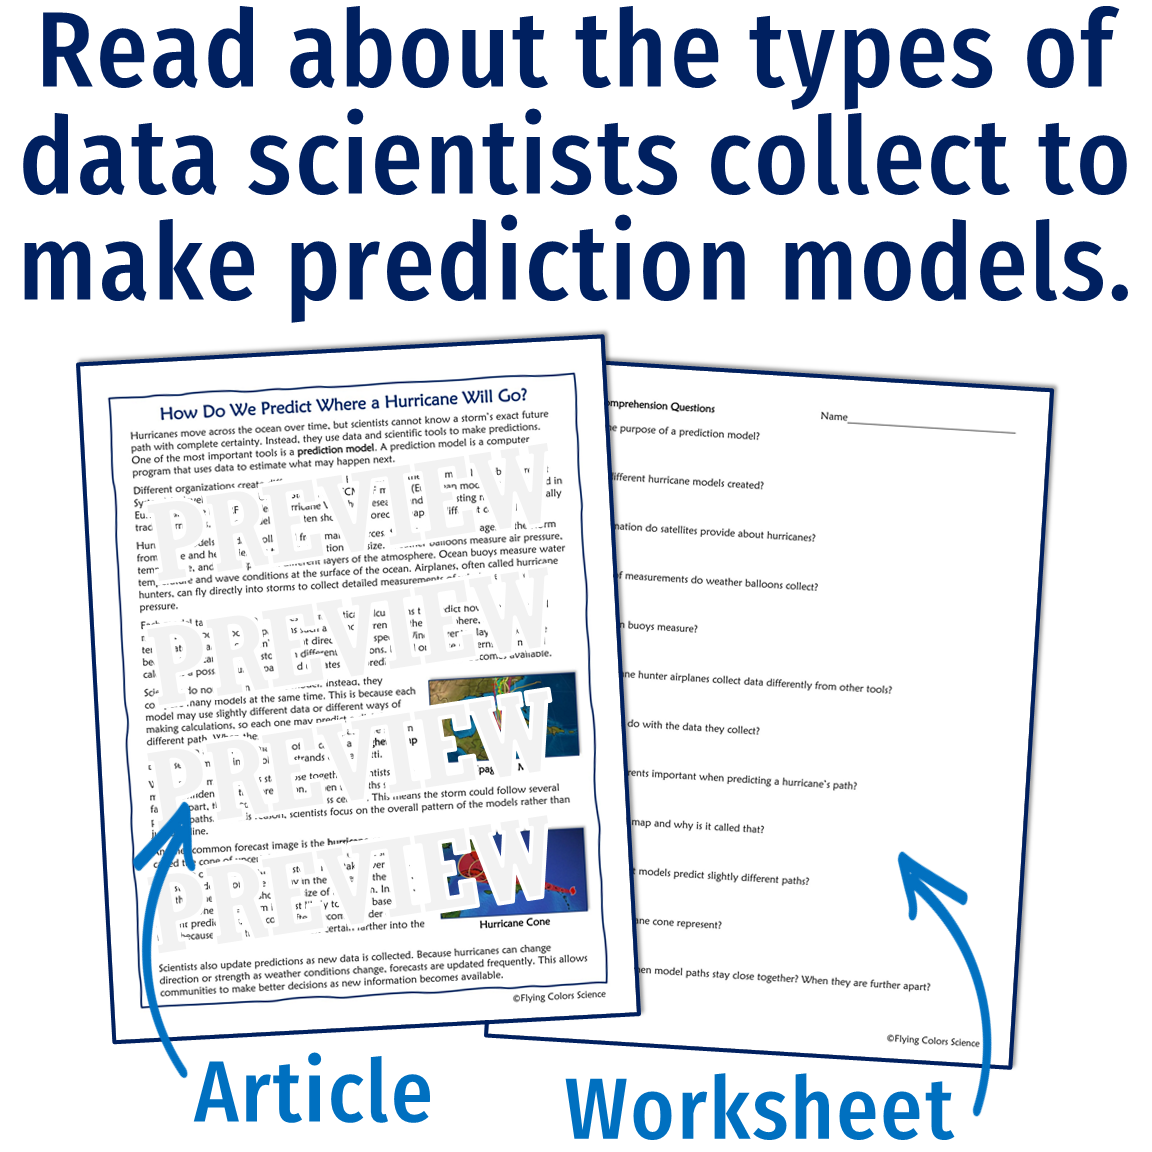
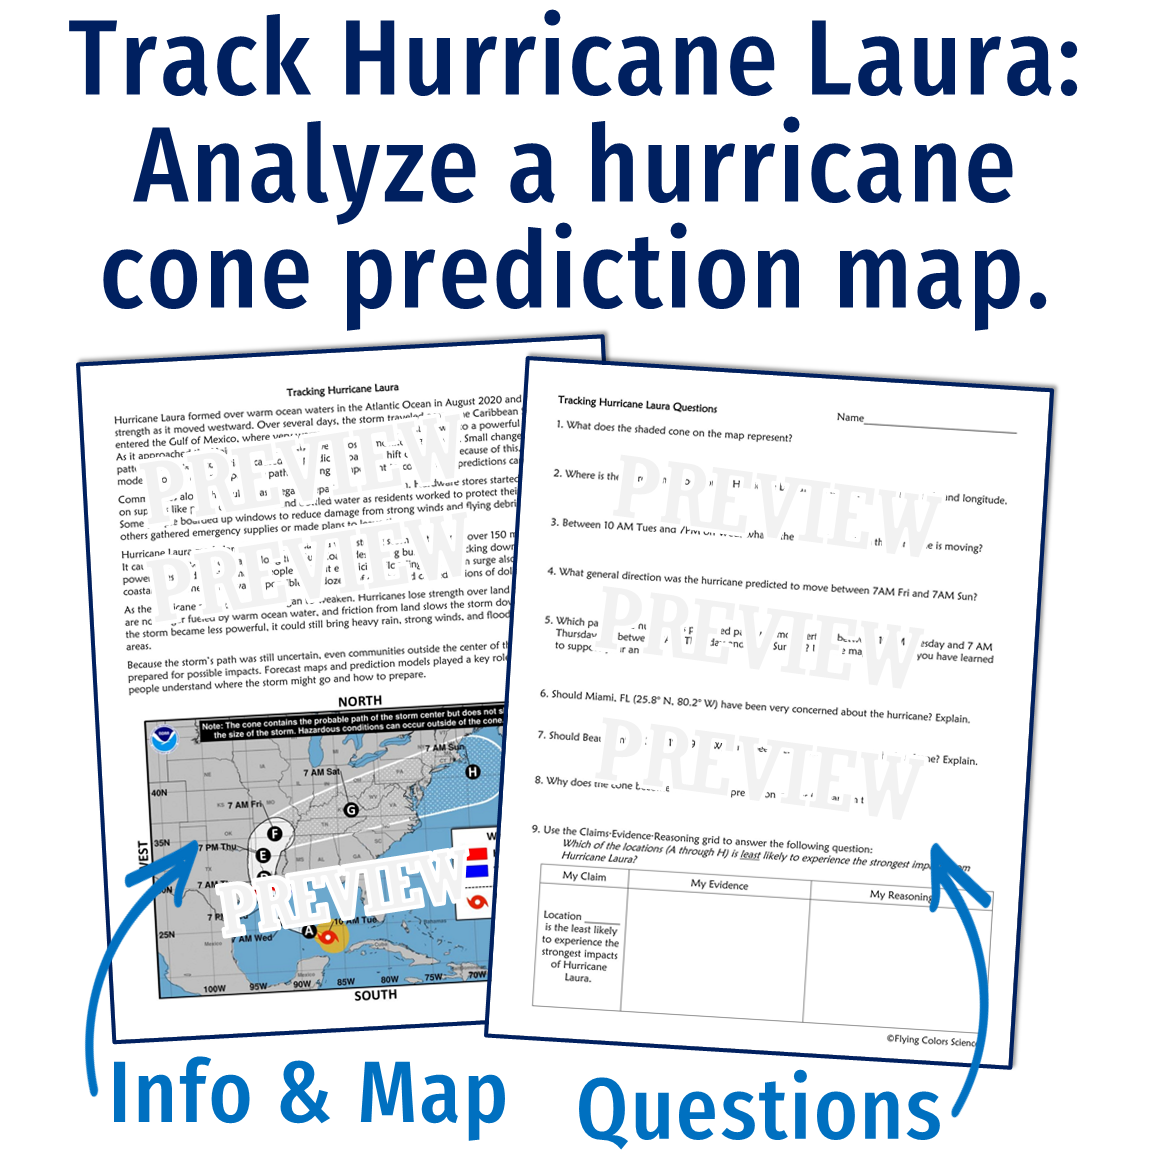
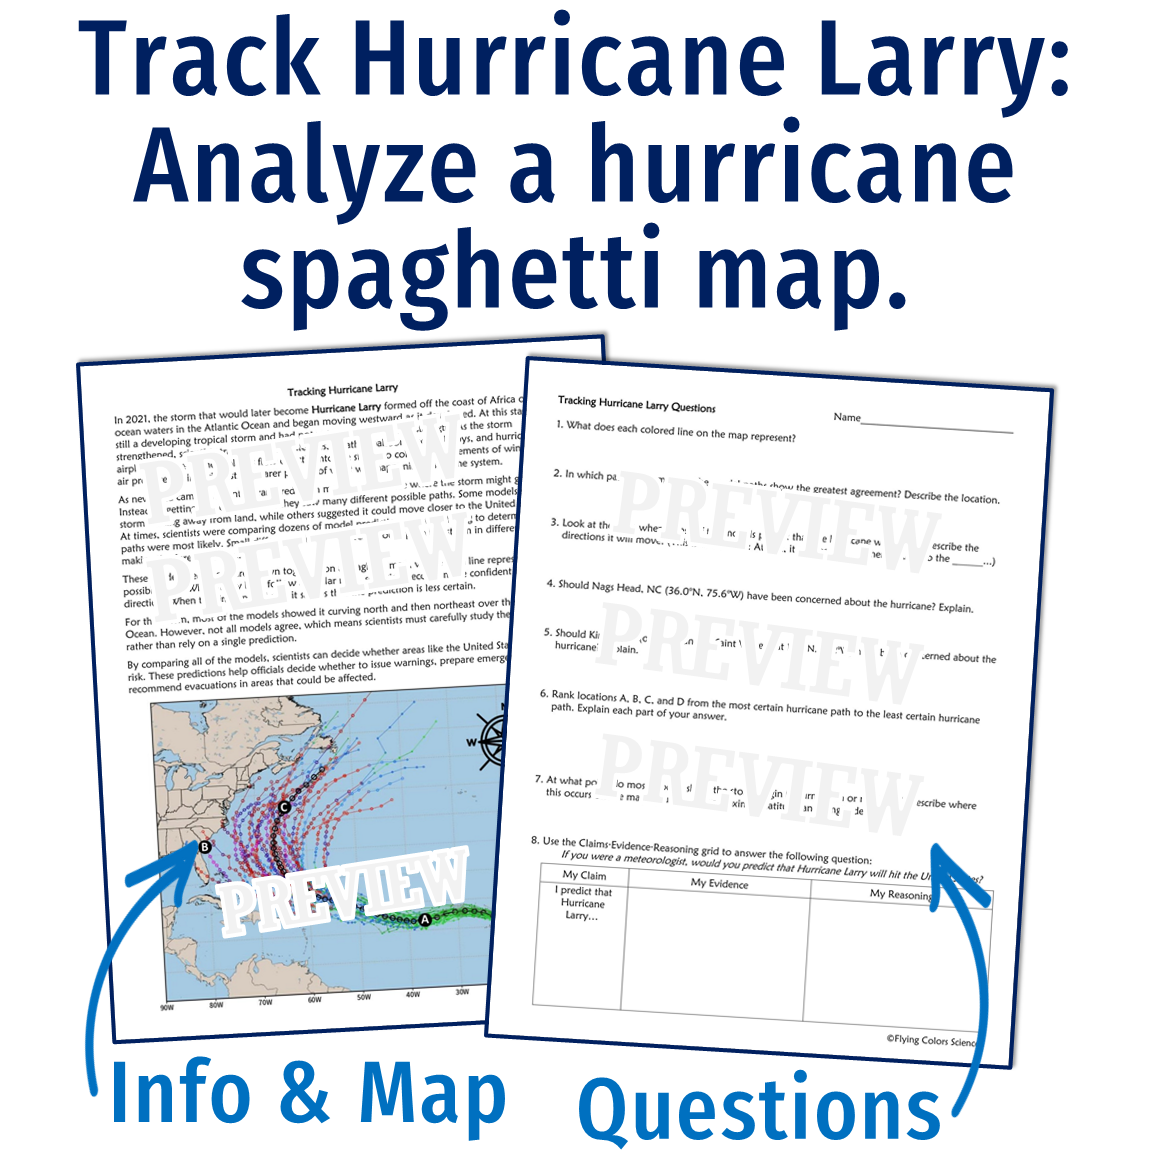
This activity focuses on the true intent of NGSS MS-ESS3-2 by having students evaluate patterns in hurricane prediction models, spaghetti maps, and forecast cones to make evidence-based decisions about storm path and potential impacts.
Please note:
This resource includes:
Teacher Notes:
$3.99
| Cookie | Duration | Description |
|---|---|---|
| cookielawinfo-checkbox-analytics | 11 months | This cookie is set by GDPR Cookie Consent plugin. The cookie is used to store the user consent for the cookies in the category "Analytics". |
| cookielawinfo-checkbox-functional | 11 months | The cookie is set by GDPR cookie consent to record the user consent for the cookies in the category "Functional". |
| cookielawinfo-checkbox-necessary | 11 months | This cookie is set by GDPR Cookie Consent plugin. The cookies is used to store the user consent for the cookies in the category "Necessary". |
| cookielawinfo-checkbox-others | 11 months | This cookie is set by GDPR Cookie Consent plugin. The cookie is used to store the user consent for the cookies in the category "Other. |
| cookielawinfo-checkbox-performance | 11 months | This cookie is set by GDPR Cookie Consent plugin. The cookie is used to store the user consent for the cookies in the category "Performance". |
| viewed_cookie_policy | 11 months | The cookie is set by the GDPR Cookie Consent plugin and is used to store whether or not user has consented to the use of cookies. It does not store any personal data. |