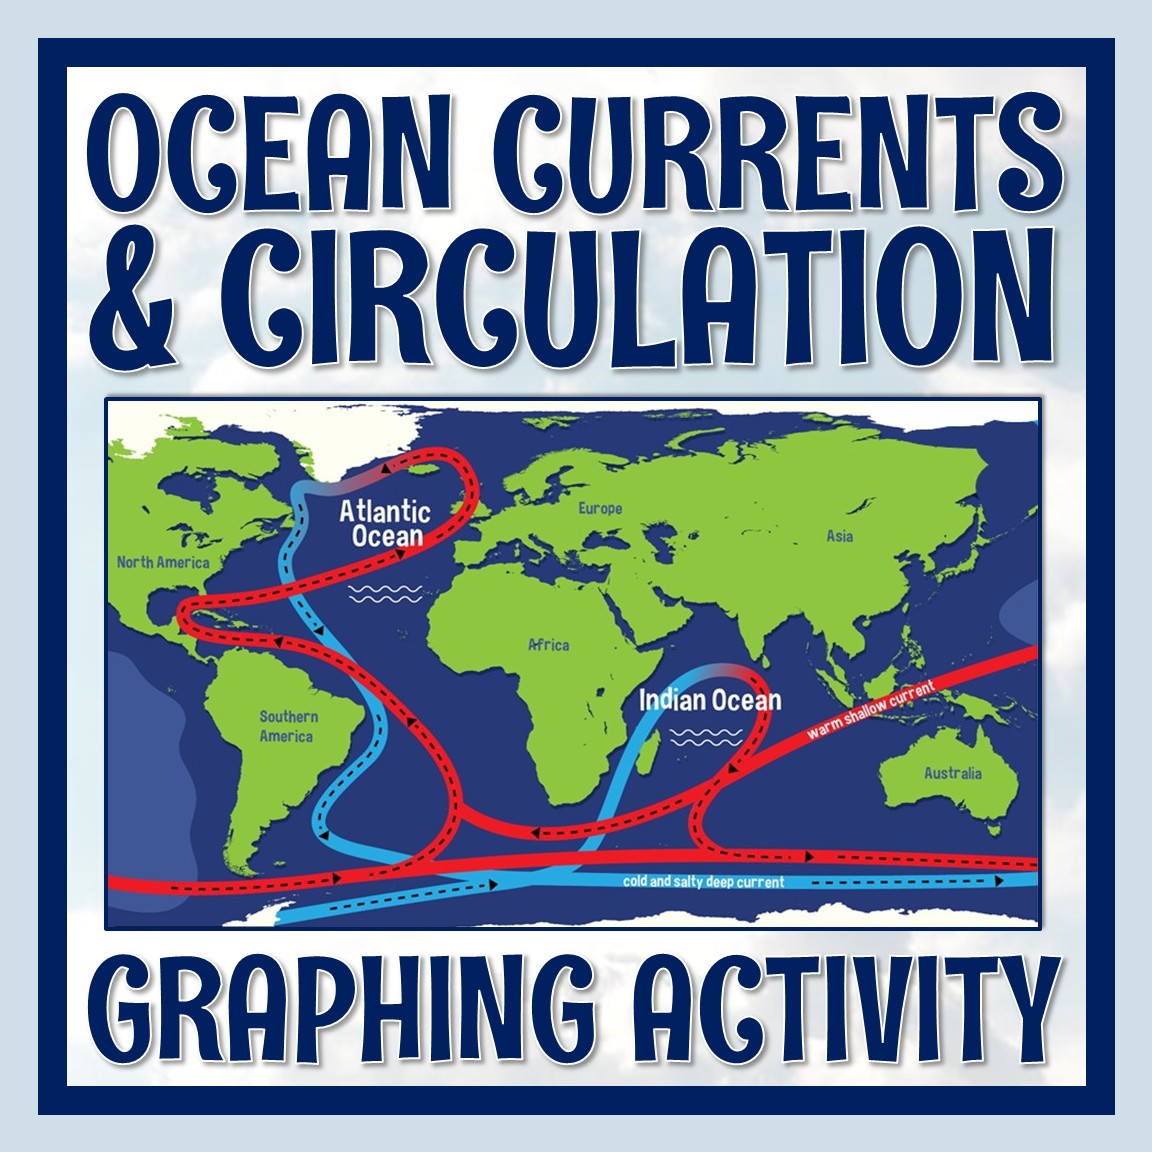
In this Oceanic Circulation Activity, students will graph and analyze how temperature and salinity differences affect water density, causing water to rise, sink, and move throughout Earth’s oceans.
Students practice SCIENCE GRAPHING SKILLS and answer questions as they extend their learning about what causes ocean currents and oceanic circulation.
There are TWO graphing worksheets included. They can be used together or completely independently of each other. The format of each activity is the same:
The two graphing topics included are:
⭐ Get this at a discount in my Atmospheric & Oceanic Circulation COMPLETE UNIT!
Teacher Notes:
| Cookie | Duration | Description |
|---|---|---|
| cookielawinfo-checkbox-analytics | 11 months | This cookie is set by GDPR Cookie Consent plugin. The cookie is used to store the user consent for the cookies in the category "Analytics". |
| cookielawinfo-checkbox-functional | 11 months | The cookie is set by GDPR cookie consent to record the user consent for the cookies in the category "Functional". |
| cookielawinfo-checkbox-necessary | 11 months | This cookie is set by GDPR Cookie Consent plugin. The cookies is used to store the user consent for the cookies in the category "Necessary". |
| cookielawinfo-checkbox-others | 11 months | This cookie is set by GDPR Cookie Consent plugin. The cookie is used to store the user consent for the cookies in the category "Other. |
| cookielawinfo-checkbox-performance | 11 months | This cookie is set by GDPR Cookie Consent plugin. The cookie is used to store the user consent for the cookies in the category "Performance". |
| viewed_cookie_policy | 11 months | The cookie is set by the GDPR Cookie Consent plugin and is used to store whether or not user has consented to the use of cookies. It does not store any personal data. |