Human Impact on the Environment: Graphing Garbage Land Pollution Activity
$5.99
Students read about where our garbage goes and then practice graphing 5 different sets of related data.
Grades 7 and Up
Get this resource at a discount in our Pollution Activities Bundle!
In this activity, students will:
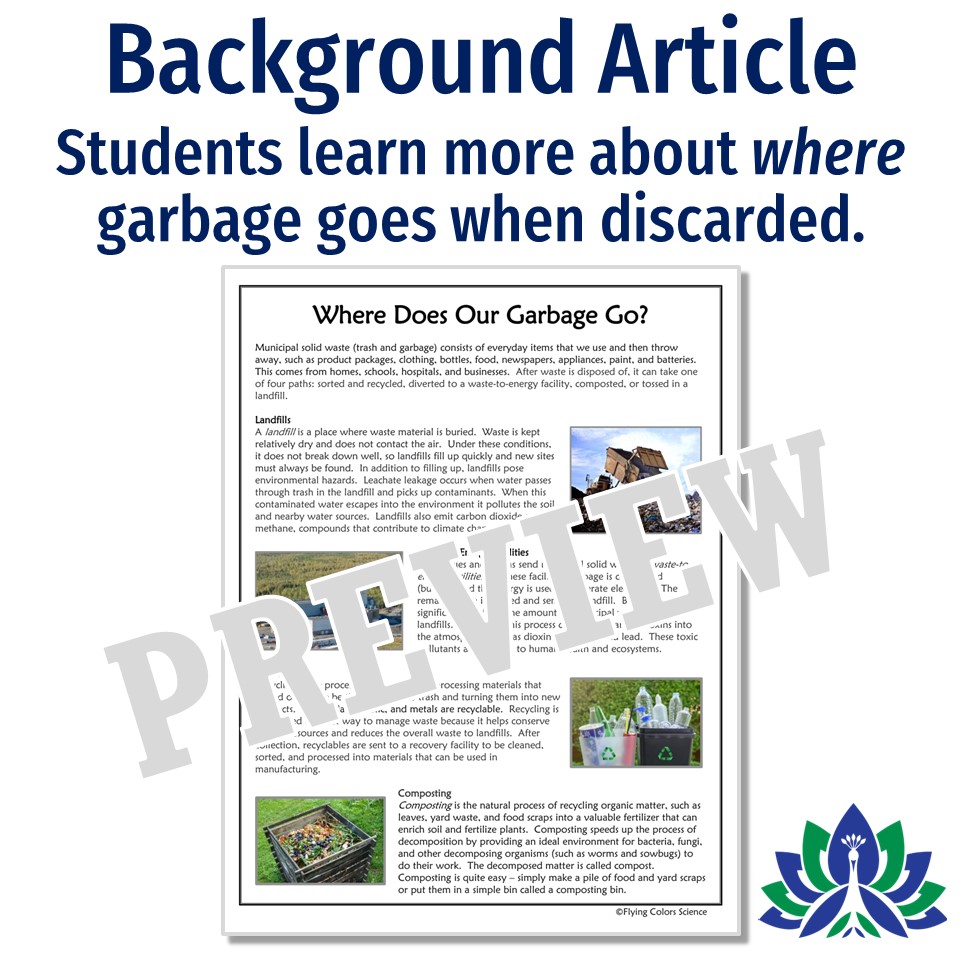
- Read an introductory article about landfills, waste-to-energy facilities, composting, and recycling. (1 page)
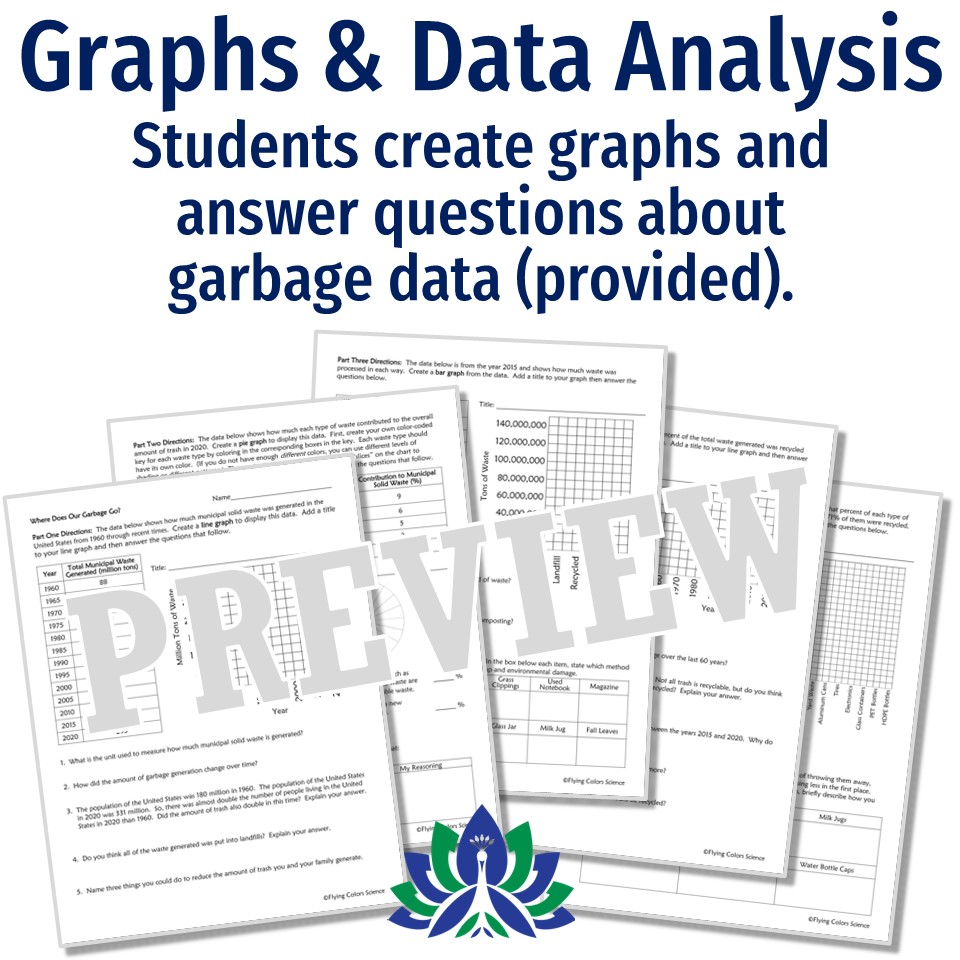
- Graph 5 different sets (4 for the digital version) of waste-related data. Line graphs, bar graphs, and a pie chart are included. (5 pages)
- Answer analysis questions based on the data.
Includes both print and digital Google Slides options to assign!
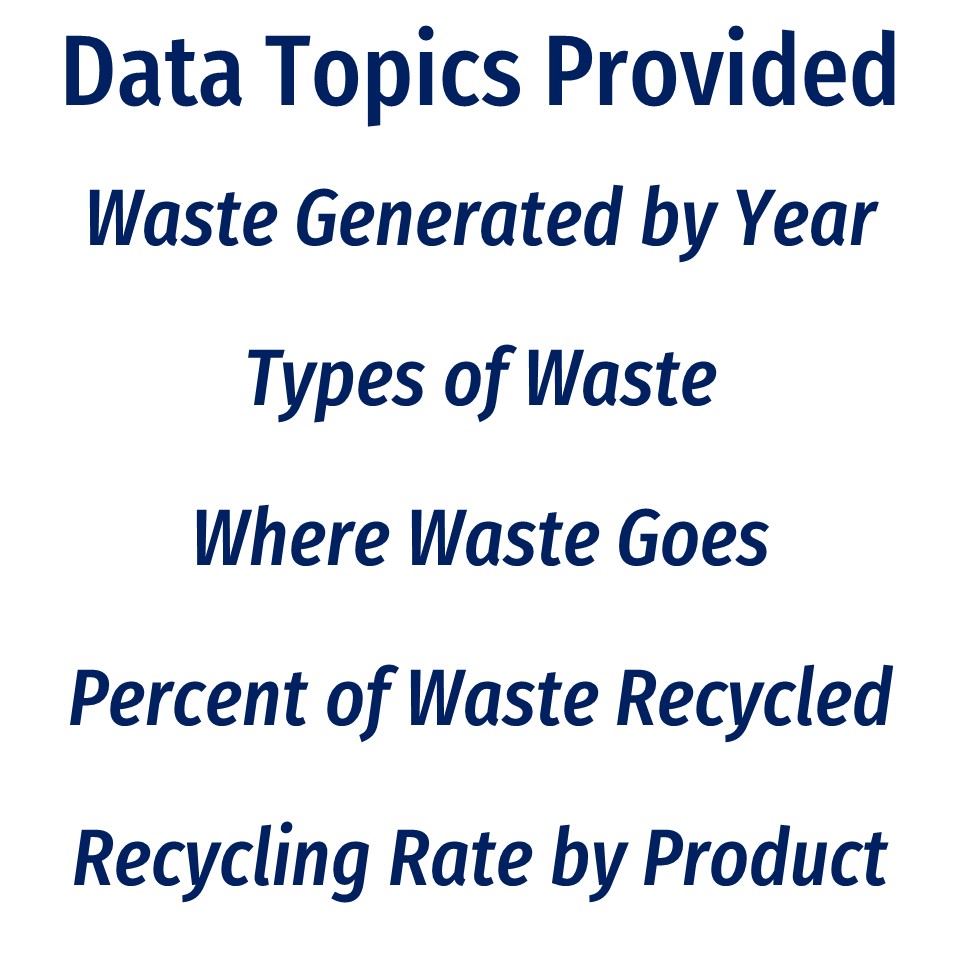
Graphs/Data Includes:
- Waste generated by year
- Types of waste (this one isn’t in the Google version)
- Where waste goes
- Percent of waste recycled by year
- Recycling rate by product type
Teacher Notes:
- NGSS Science & Engineering Practices: Analyzing and interpreting data; Using mathematics and computational thinking
- ANSWER KEY INCLUDED.
- Please note: this resource is not editable.
- No prior knowledge is required – all information in the questions comes directly from the information provided.
- Go paperless! This activity includes a version in Google Slides.
- Check out more resources in the human impact section of our shop!
Be the first to review “Human Impact on the Environment: Graphing Garbage Land Pollution Activity” Cancel reply
You might also like...
Related products
-
Earth and Space
Human Impact on the Environment: Water Pollution Stations Activity
$5.99 Add to cart

Reviews
There are no reviews yet.