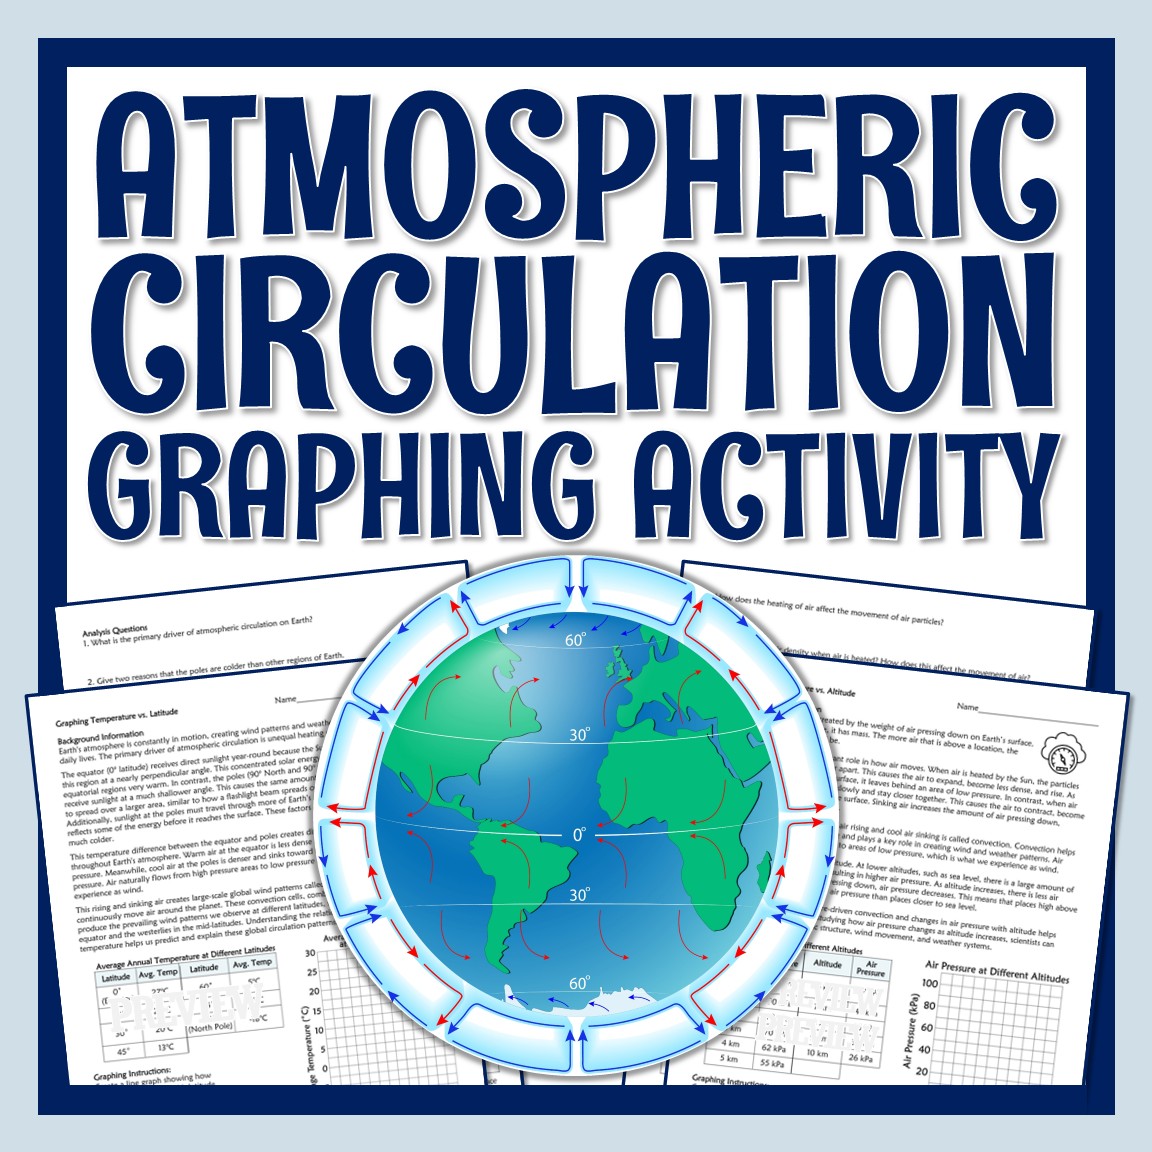
This atmospheric circulation activity will have your students analyzing real data and creating graphs! In this no-prep middle school Earth science activity, students graph temperature vs. latitude and air pressure vs. altitude to explore how unequal heating of Earth’s surface drives global wind and pressure patterns.
This resource is aligned to NGSS MS-ESS2-6.
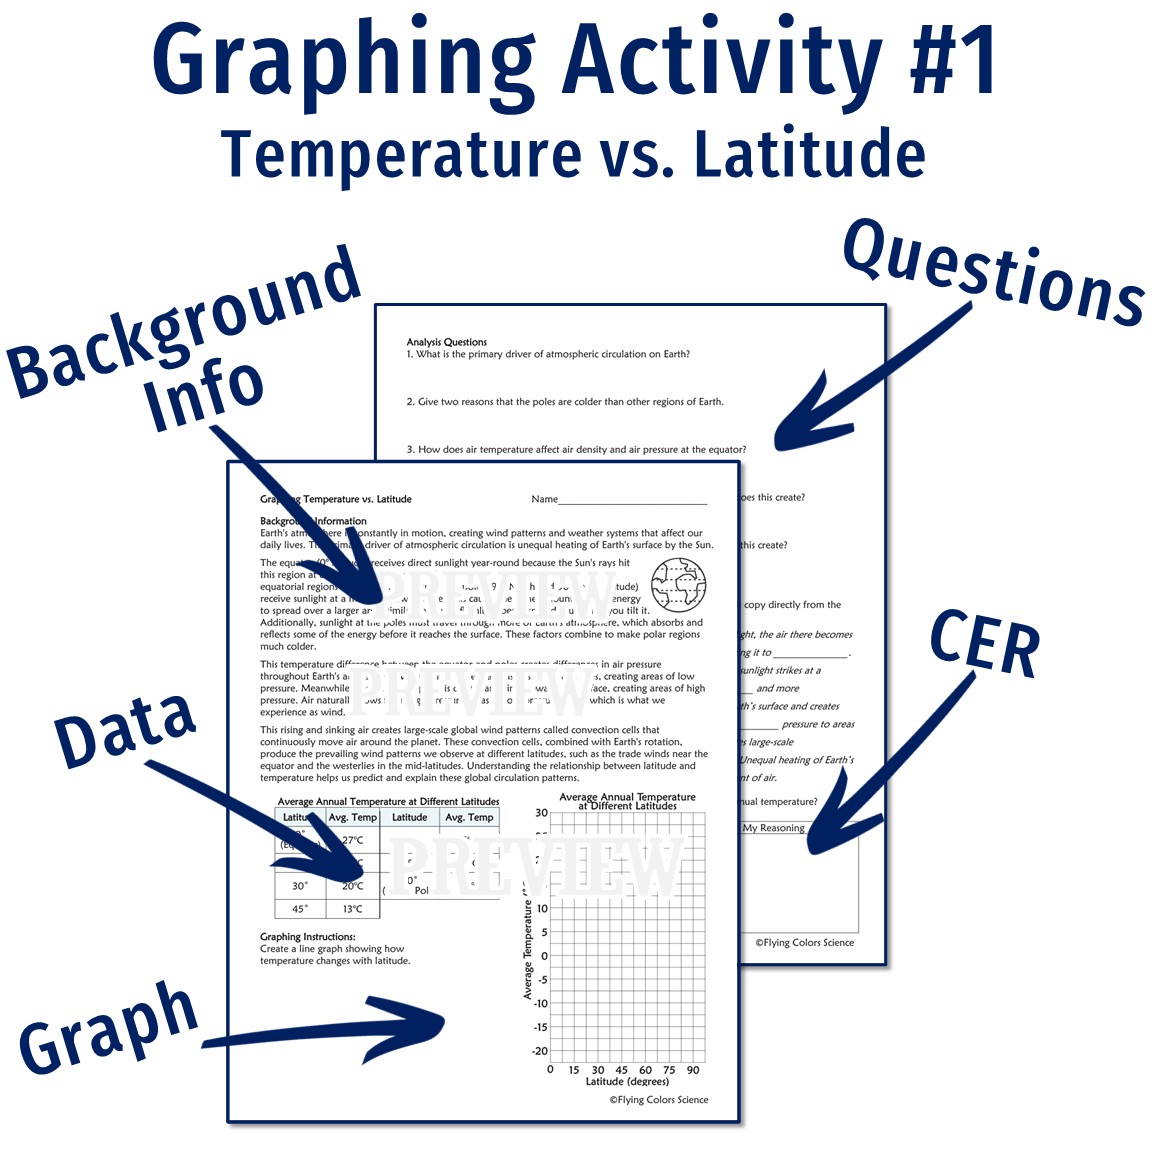
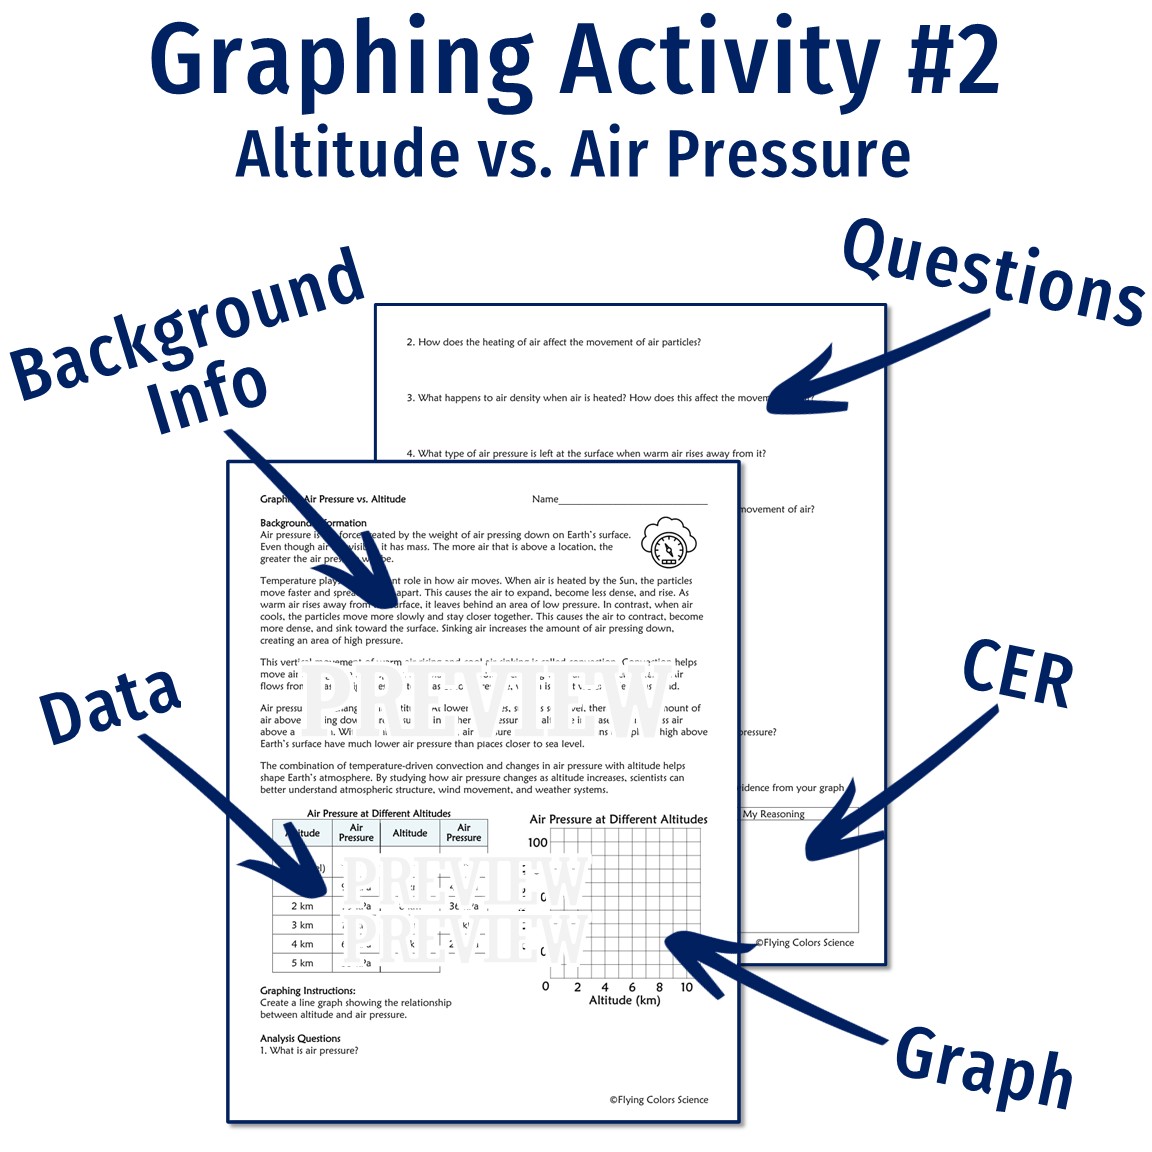
There are TWO graphing worksheets included. They can be used together or completely independently of each other. The format of each activity is the same:
The two graphing topics included are:
⭐ Get this at a discount in my Atmospheric & Oceanic Circulation COMPLETE UNIT!
Teacher Notes:
$3.50
| Cookie | Duration | Description |
|---|---|---|
| cookielawinfo-checkbox-analytics | 11 months | This cookie is set by GDPR Cookie Consent plugin. The cookie is used to store the user consent for the cookies in the category "Analytics". |
| cookielawinfo-checkbox-functional | 11 months | The cookie is set by GDPR cookie consent to record the user consent for the cookies in the category "Functional". |
| cookielawinfo-checkbox-necessary | 11 months | This cookie is set by GDPR Cookie Consent plugin. The cookies is used to store the user consent for the cookies in the category "Necessary". |
| cookielawinfo-checkbox-others | 11 months | This cookie is set by GDPR Cookie Consent plugin. The cookie is used to store the user consent for the cookies in the category "Other. |
| cookielawinfo-checkbox-performance | 11 months | This cookie is set by GDPR Cookie Consent plugin. The cookie is used to store the user consent for the cookies in the category "Performance". |
| viewed_cookie_policy | 11 months | The cookie is set by the GDPR Cookie Consent plugin and is used to store whether or not user has consented to the use of cookies. It does not store any personal data. |