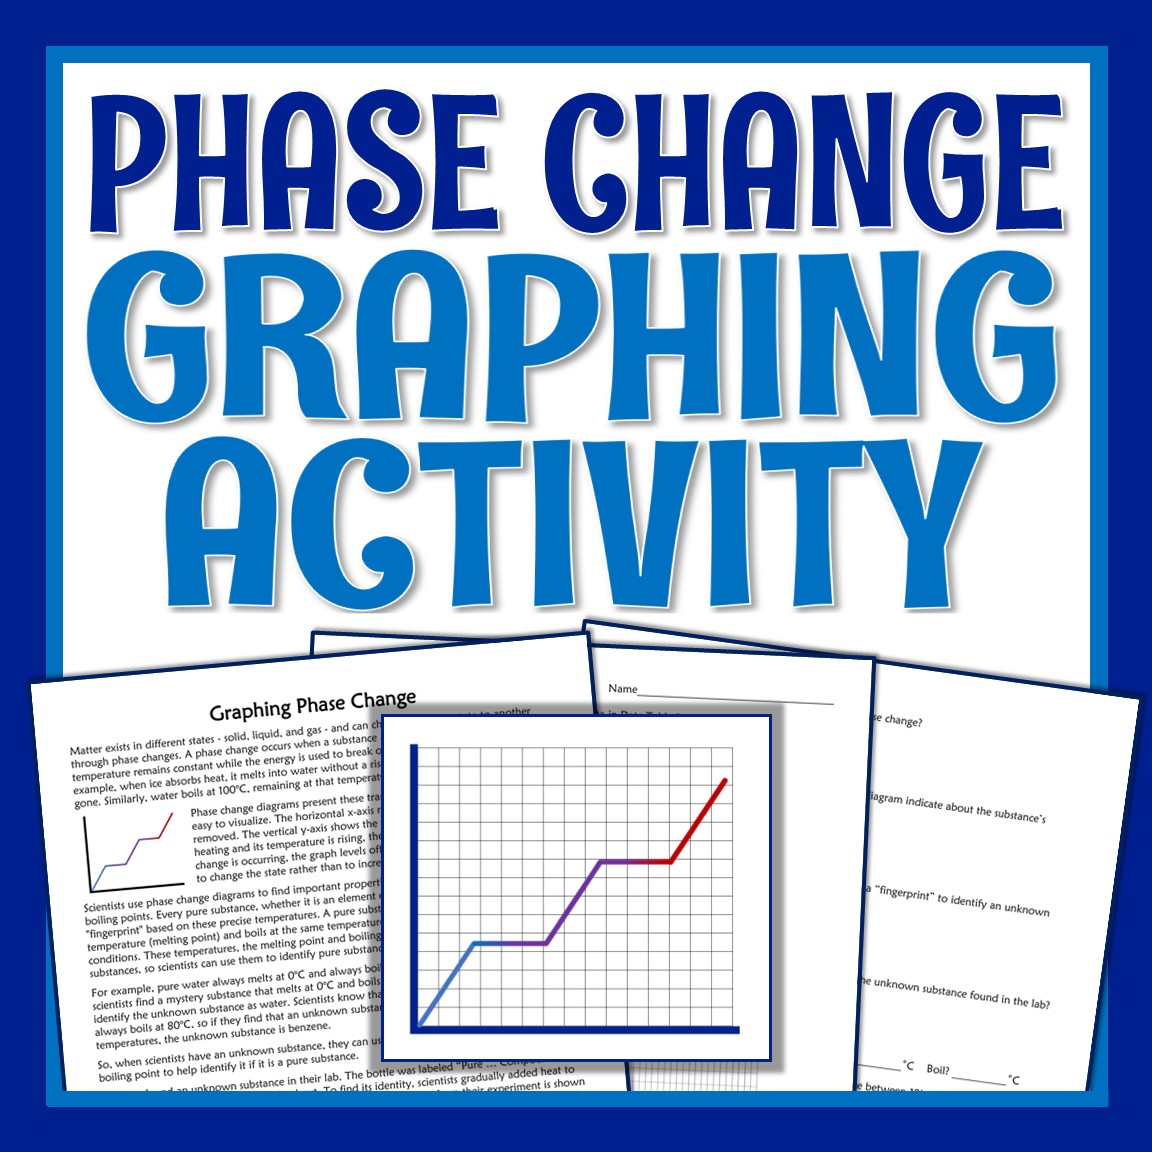
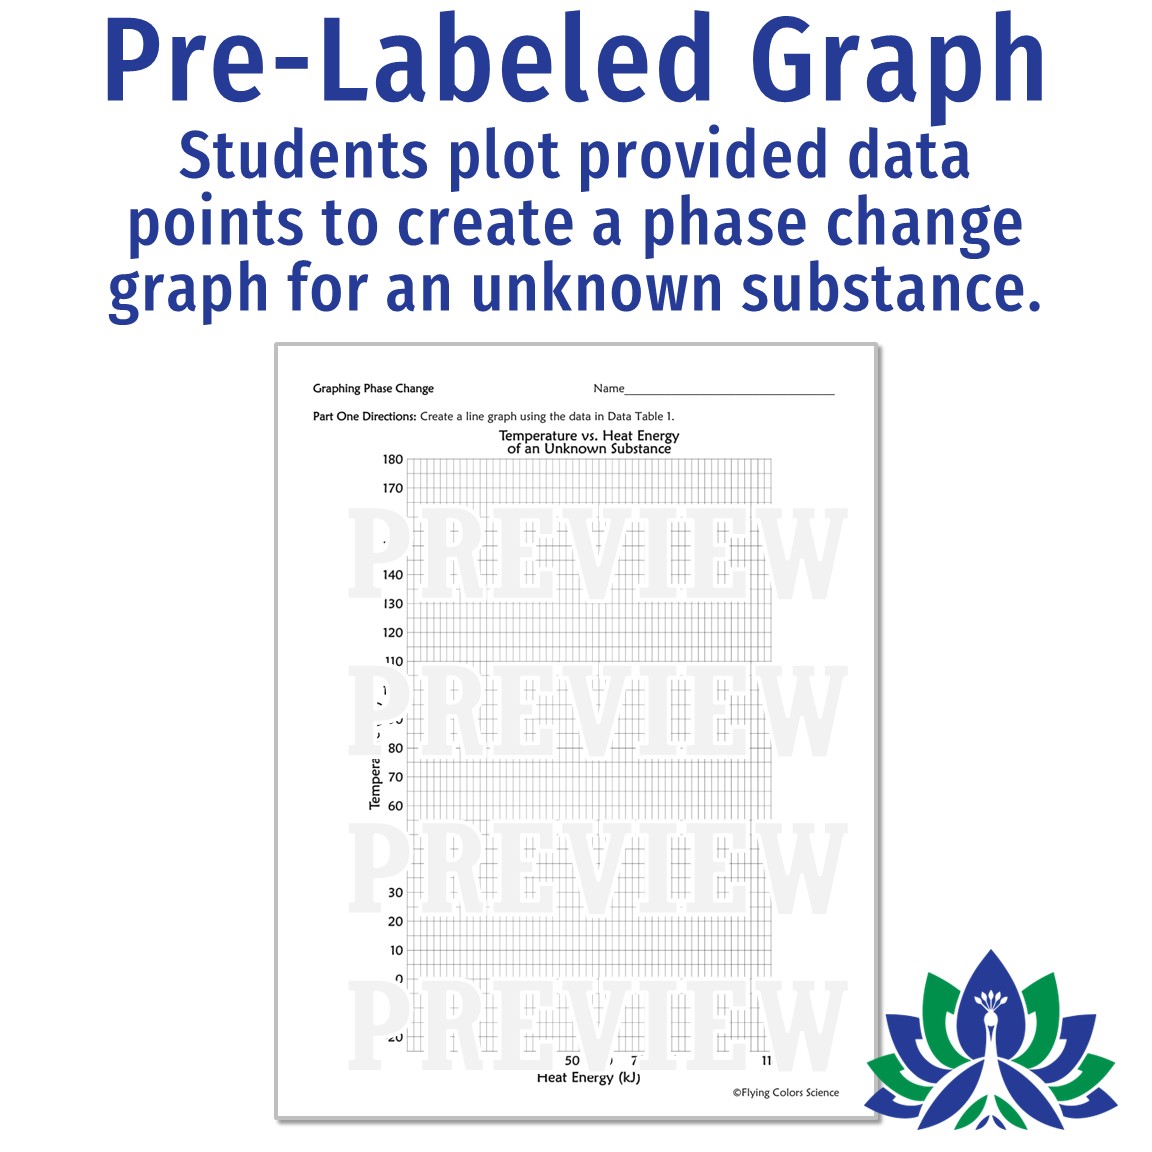
This phase change graph activity has students graph heat energy versus temperature data to create THEIR OWN PHASE CHANGE DIAGRAM.
And this activity takes it a bit further to include the characteristic properties of melting point and boiling point!
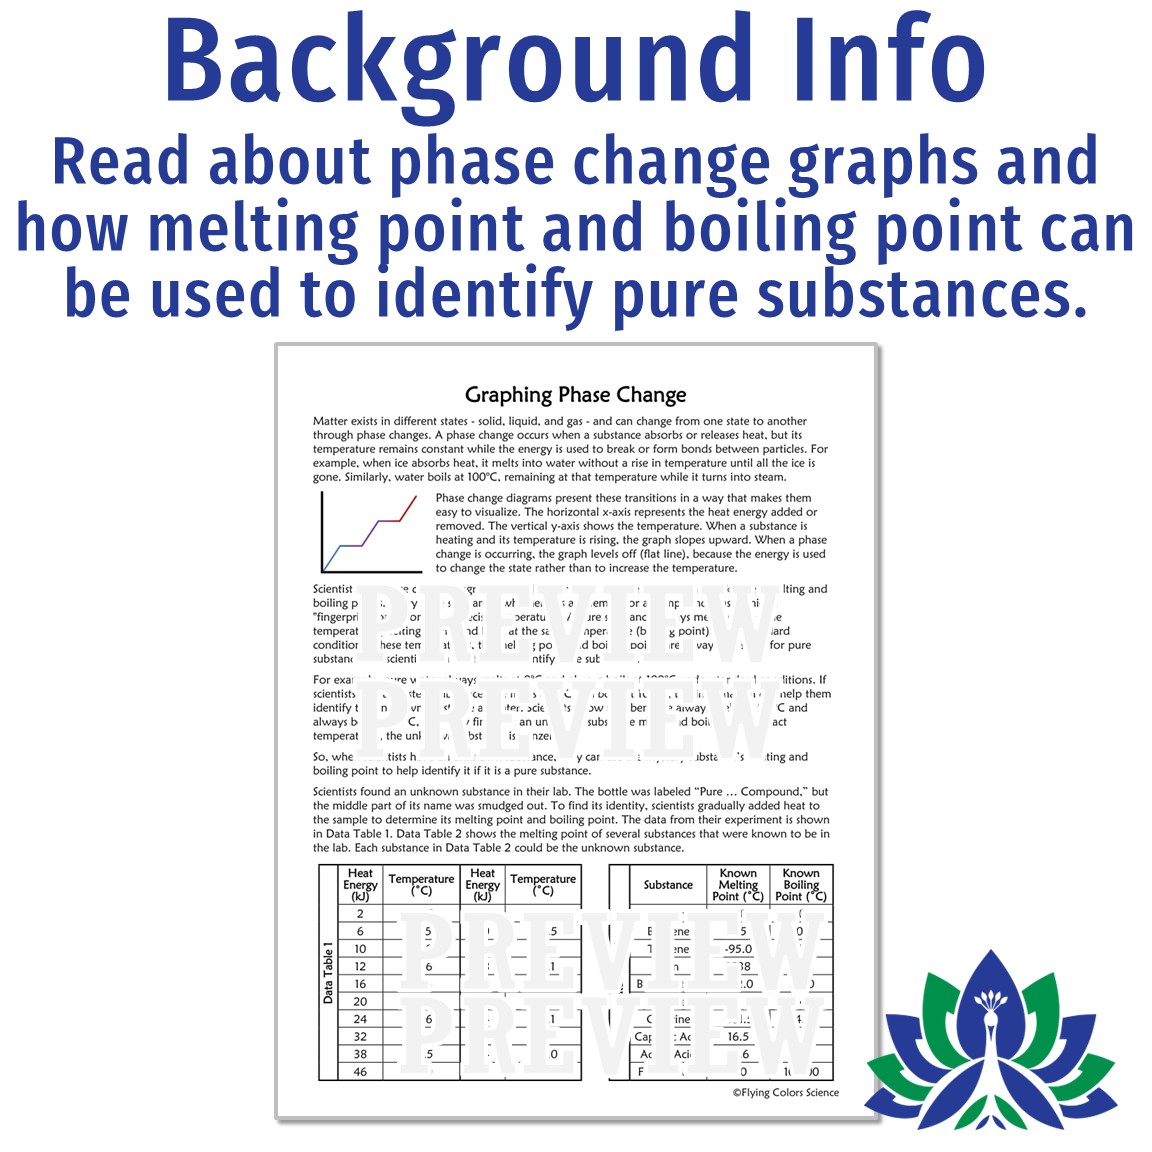
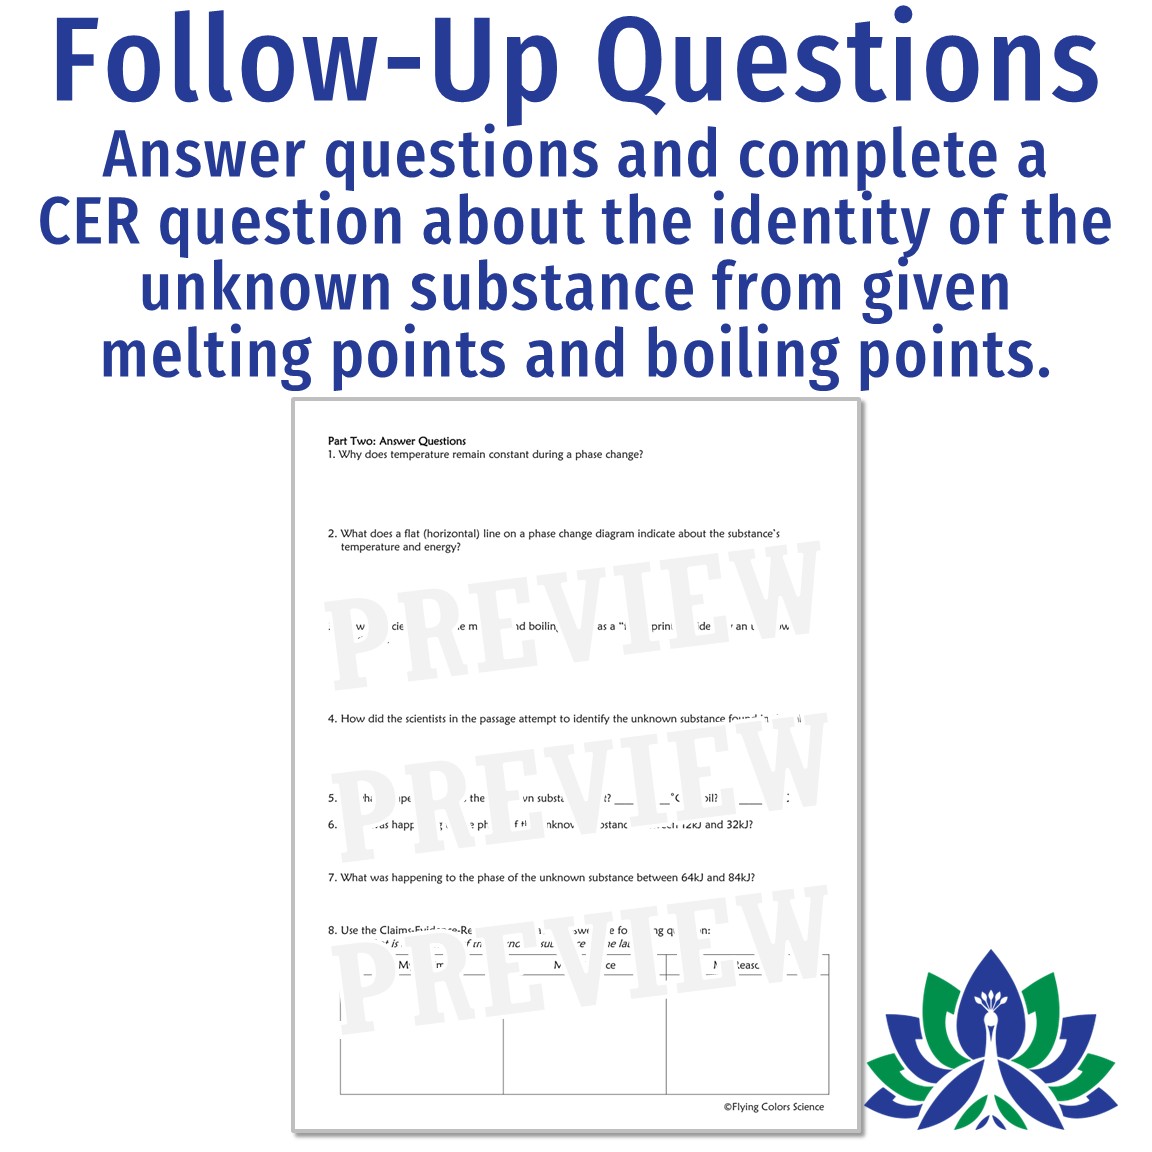
Students are given heat energy data about an unknown substance. After they graph the data, they can clearly see the melting point and boiling point of the substance. By comparing these characteristic properties to several given known substances, students can figure out (and make a claim based on evidence about) the identity of the unknown substance from the graph.
In this activity, students will:
Teacher Notes:
| Cookie | Duration | Description |
|---|---|---|
| cookielawinfo-checkbox-analytics | 11 months | This cookie is set by GDPR Cookie Consent plugin. The cookie is used to store the user consent for the cookies in the category "Analytics". |
| cookielawinfo-checkbox-functional | 11 months | The cookie is set by GDPR cookie consent to record the user consent for the cookies in the category "Functional". |
| cookielawinfo-checkbox-necessary | 11 months | This cookie is set by GDPR Cookie Consent plugin. The cookies is used to store the user consent for the cookies in the category "Necessary". |
| cookielawinfo-checkbox-others | 11 months | This cookie is set by GDPR Cookie Consent plugin. The cookie is used to store the user consent for the cookies in the category "Other. |
| cookielawinfo-checkbox-performance | 11 months | This cookie is set by GDPR Cookie Consent plugin. The cookie is used to store the user consent for the cookies in the category "Performance". |
| viewed_cookie_policy | 11 months | The cookie is set by the GDPR Cookie Consent plugin and is used to store whether or not user has consented to the use of cookies. It does not store any personal data. |