Get this activity at a discount in our complete SEASONS UNIT!
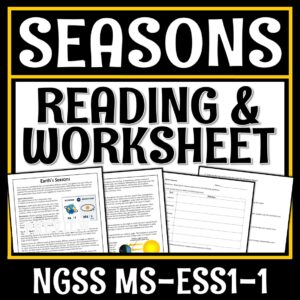
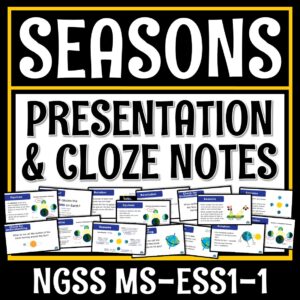
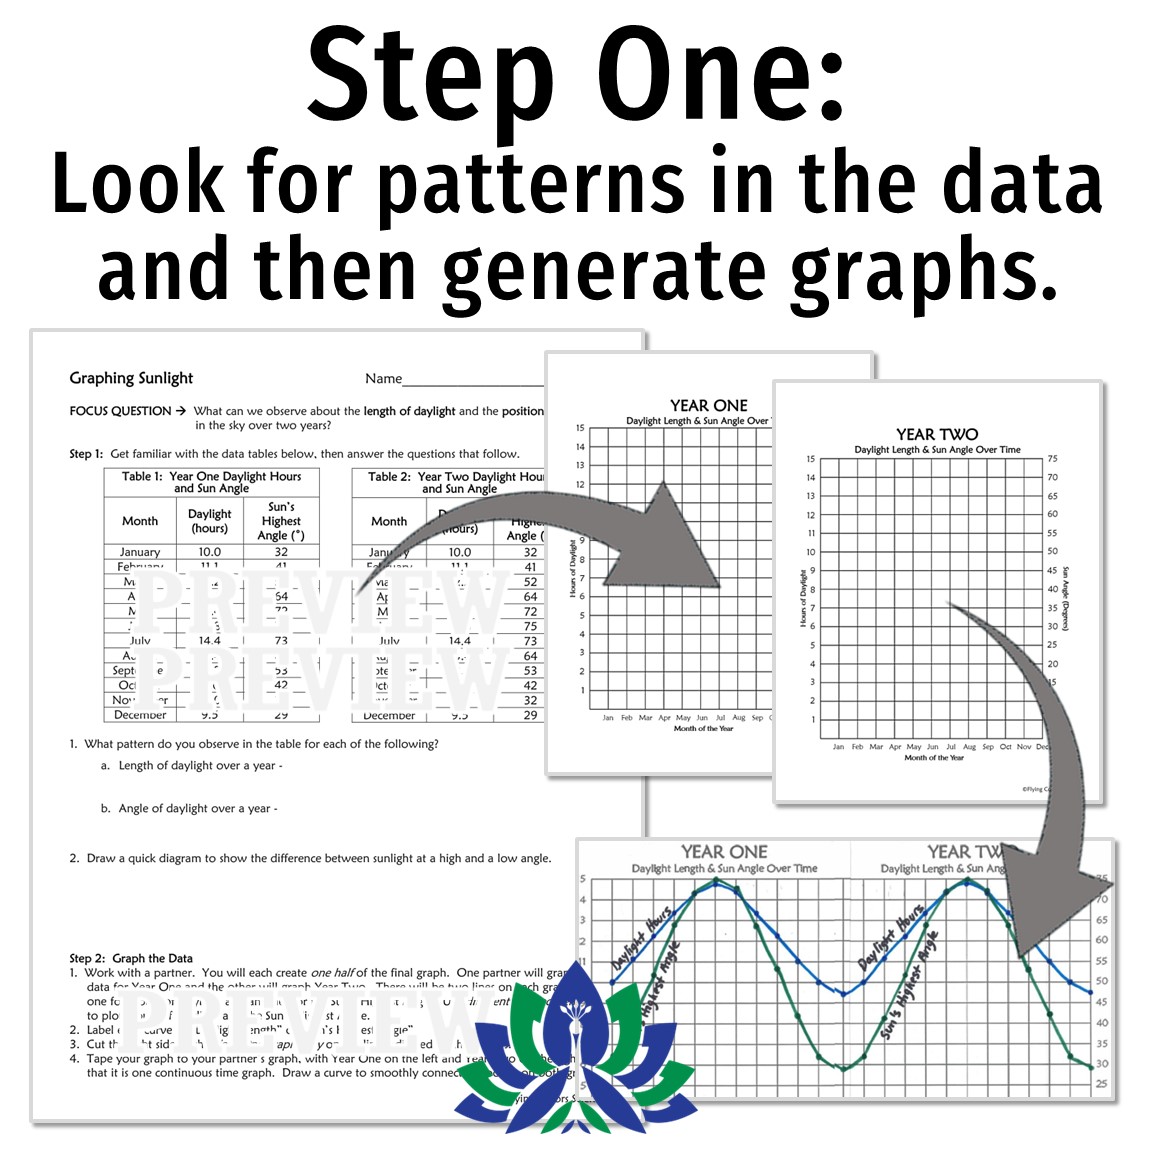
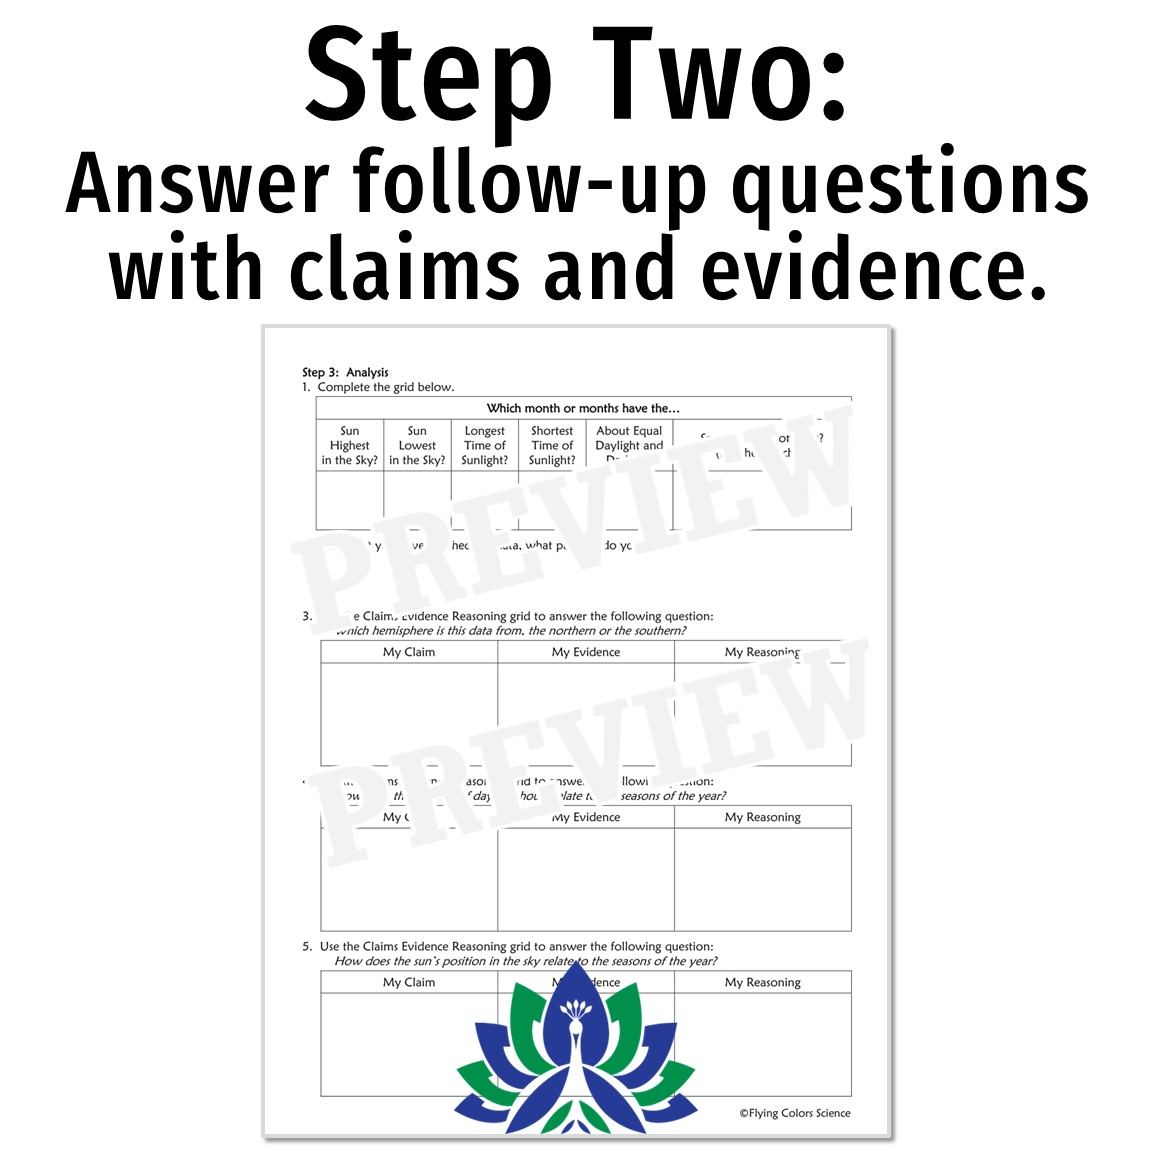
Inquiry-based activity! Provide middle school students a deeper understanding of Earth’s seasons through the analysis of a student-generated graph. Clear worksheet instructions, easy-to-graph data, and a nice analysis section combine to make a really worthwhile activity!
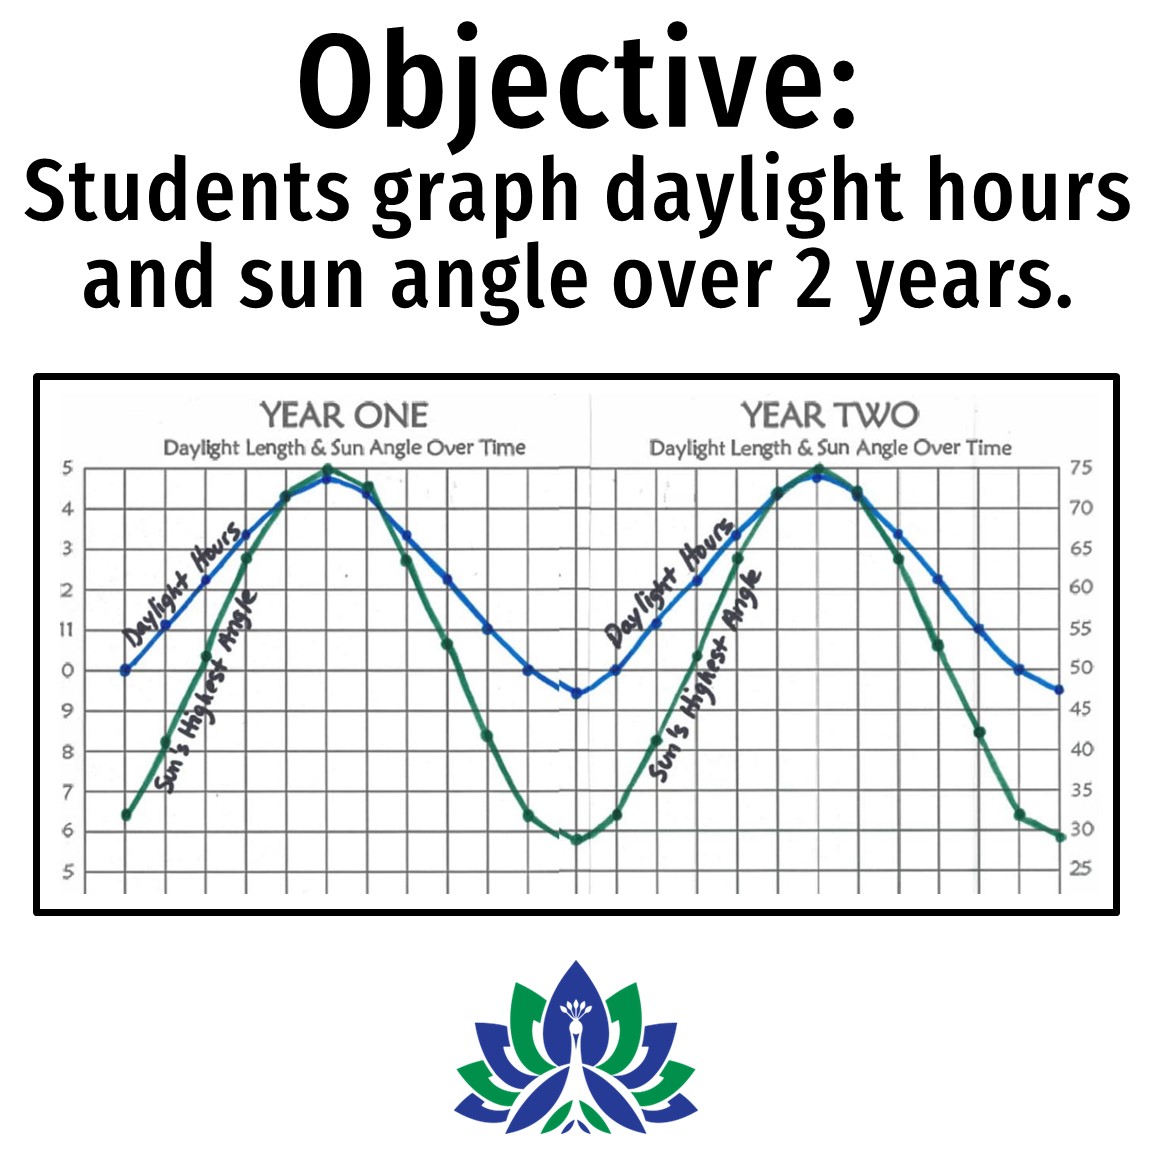
Objective: Graph the relationship between the seasons and angle of sunlight, as well as the seasons and length of daylight hours.
In this activity, students will:
Teacher Notes:
Related Standards:

$4.50
| Cookie | Duration | Description |
|---|---|---|
| cookielawinfo-checkbox-analytics | 11 months | This cookie is set by GDPR Cookie Consent plugin. The cookie is used to store the user consent for the cookies in the category "Analytics". |
| cookielawinfo-checkbox-functional | 11 months | The cookie is set by GDPR cookie consent to record the user consent for the cookies in the category "Functional". |
| cookielawinfo-checkbox-necessary | 11 months | This cookie is set by GDPR Cookie Consent plugin. The cookies is used to store the user consent for the cookies in the category "Necessary". |
| cookielawinfo-checkbox-others | 11 months | This cookie is set by GDPR Cookie Consent plugin. The cookie is used to store the user consent for the cookies in the category "Other. |
| cookielawinfo-checkbox-performance | 11 months | This cookie is set by GDPR Cookie Consent plugin. The cookie is used to store the user consent for the cookies in the category "Performance". |
| viewed_cookie_policy | 11 months | The cookie is set by the GDPR Cookie Consent plugin and is used to store whether or not user has consented to the use of cookies. It does not store any personal data. |