


Related products
-
Earth and Space
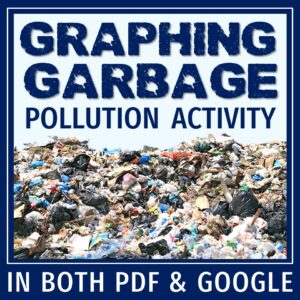
Human Impact on the Environment: Graphing Garbage Land Pollution Activity
$5.99 Add to cart
$16.99
Add ENGAGEMENT and RIGOR with these NO PREP activities!
Grades 7 and Up
SAVE MORE THAN 30% on this climate change activities bundle PACKED with high-quality, rigorous climate change activities that are NO PREP and EASY TO IMPLEMENT. This activity bundle has a little bit of everything!
⭐ Get these climate change activities at a huge discount in our comprehensive Climate Change Unit!
Resources Included:
Individual Descriptions:
Climate Read and Respond CER Activity: Stimulate CRITICAL THINKING with this read and respond CLIMATE CHANGE ACTIVITY. Students read short text passages on various climate change topics, then complete short answer questions, flow charts, claims-evidence-reasoning prompts, and cause-and-effect grids. Included text passages and questions in this resource relate to:
Two Truths and a Lie Critical Thinking Activity: Get kids THINKING! Promote lively discussions and critical thinking about global warming and related issues using a “Two Truths and a Lie” activity. In this activity, students will:
Climate Change Graphing Worksheet: Critical thinking required! Students analyze and compare 6 graphs related to climate change and complete a Claims-Evidence-Reasoning (CER) grid.
Graphing Climate Data Activity: In this activity, students will:
Mapping Carbon Emissions Activity: In this activity, students will:
Teacher Notes:
© Flying Colors Science 2024 | Terms & Conditions | Privacy Policy | Disclaimer
| Cookie | Duration | Description |
|---|---|---|
| cookielawinfo-checkbox-analytics | 11 months | This cookie is set by GDPR Cookie Consent plugin. The cookie is used to store the user consent for the cookies in the category "Analytics". |
| cookielawinfo-checkbox-functional | 11 months | The cookie is set by GDPR cookie consent to record the user consent for the cookies in the category "Functional". |
| cookielawinfo-checkbox-necessary | 11 months | This cookie is set by GDPR Cookie Consent plugin. The cookies is used to store the user consent for the cookies in the category "Necessary". |
| cookielawinfo-checkbox-others | 11 months | This cookie is set by GDPR Cookie Consent plugin. The cookie is used to store the user consent for the cookies in the category "Other. |
| cookielawinfo-checkbox-performance | 11 months | This cookie is set by GDPR Cookie Consent plugin. The cookie is used to store the user consent for the cookies in the category "Performance". |
| viewed_cookie_policy | 11 months | The cookie is set by the GDPR Cookie Consent plugin and is used to store whether or not user has consented to the use of cookies. It does not store any personal data. |


Reviews
There are no reviews yet.