


Related products
-
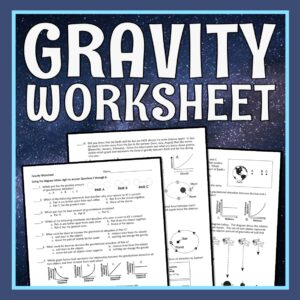
Earth and Space
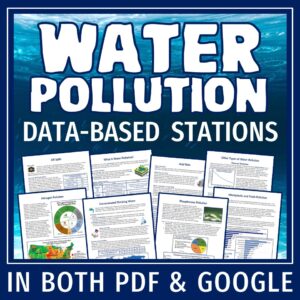
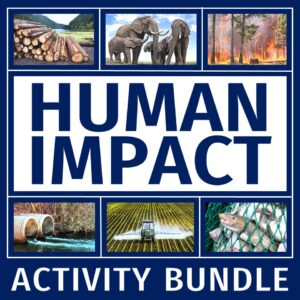
Human Impact on the Environment: Water Pollution Stations Activity
$5.99 Add to cart
$5.50
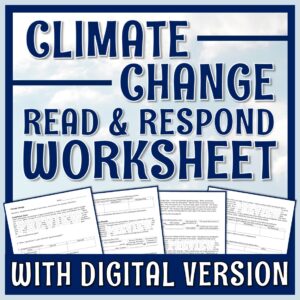
Students map global carbon emissions to see where the most carbon is entering the atmosphere.
Grades 7-10
Get this climate change activity at a huge discount in our comprehensive Climate Change Unit!
Students use real data to color-code a map of 68 countries based on their per capita carbon emissions.
In this activity, students will:
Related Standards:
Teacher Notes:
© Flying Colors Science 2024 | Terms & Conditions | Privacy Policy | Disclaimer
| Cookie | Duration | Description |
|---|---|---|
| cookielawinfo-checkbox-analytics | 11 months | This cookie is set by GDPR Cookie Consent plugin. The cookie is used to store the user consent for the cookies in the category "Analytics". |
| cookielawinfo-checkbox-functional | 11 months | The cookie is set by GDPR cookie consent to record the user consent for the cookies in the category "Functional". |
| cookielawinfo-checkbox-necessary | 11 months | This cookie is set by GDPR Cookie Consent plugin. The cookies is used to store the user consent for the cookies in the category "Necessary". |
| cookielawinfo-checkbox-others | 11 months | This cookie is set by GDPR Cookie Consent plugin. The cookie is used to store the user consent for the cookies in the category "Other. |
| cookielawinfo-checkbox-performance | 11 months | This cookie is set by GDPR Cookie Consent plugin. The cookie is used to store the user consent for the cookies in the category "Performance". |
| viewed_cookie_policy | 11 months | The cookie is set by the GDPR Cookie Consent plugin and is used to store whether or not user has consented to the use of cookies. It does not store any personal data. |
Reviews
There are no reviews yet.